
Where Water Goes: How Terrain Shapes Vegetation Water Use in the Western Cape
Research by Hanu Mostert, MSc | Stellenbosch University | December 2025
Water scarcity is one of the Western Cape’s most pressing long-term challenges. The 2018 Day Zero crisis brought this reality into sharp focus, but the pressures driving it, such as a growing population, shifting rainfall patterns, and increasing evaporative demand, have not gone away. Understanding where water goes, and why, is therefore not just an academic exercise; it has direct consequences for how land is managed, where forests are planted, and how scarce water resources are allocated.
A recent master’s thesis by Hanu Mostert, conducted at Stellenbosch University in collaboration with the Water Research Commission, set out to answer the question: does the shape of the land influence how much water vegetation uses? The answer, as it turns out, is a meaningful yes. The research required building the most accurate automated terrain map of the Western Cape ever produced, using Geosmart’s own SUDEM elevation model.
Mapping the Western Cape’s Terrain
Before the relationship between terrain and water use could be explored, a reliable map of landforms across the entire province was needed. The Western Cape is topographically diverse: the Cape Fold Belt mountains rise to over 2 000 metres, coastal plains stretch toward the Atlantic and Indian Oceans, and elevated interior plateaus define the northern reaches of the province.
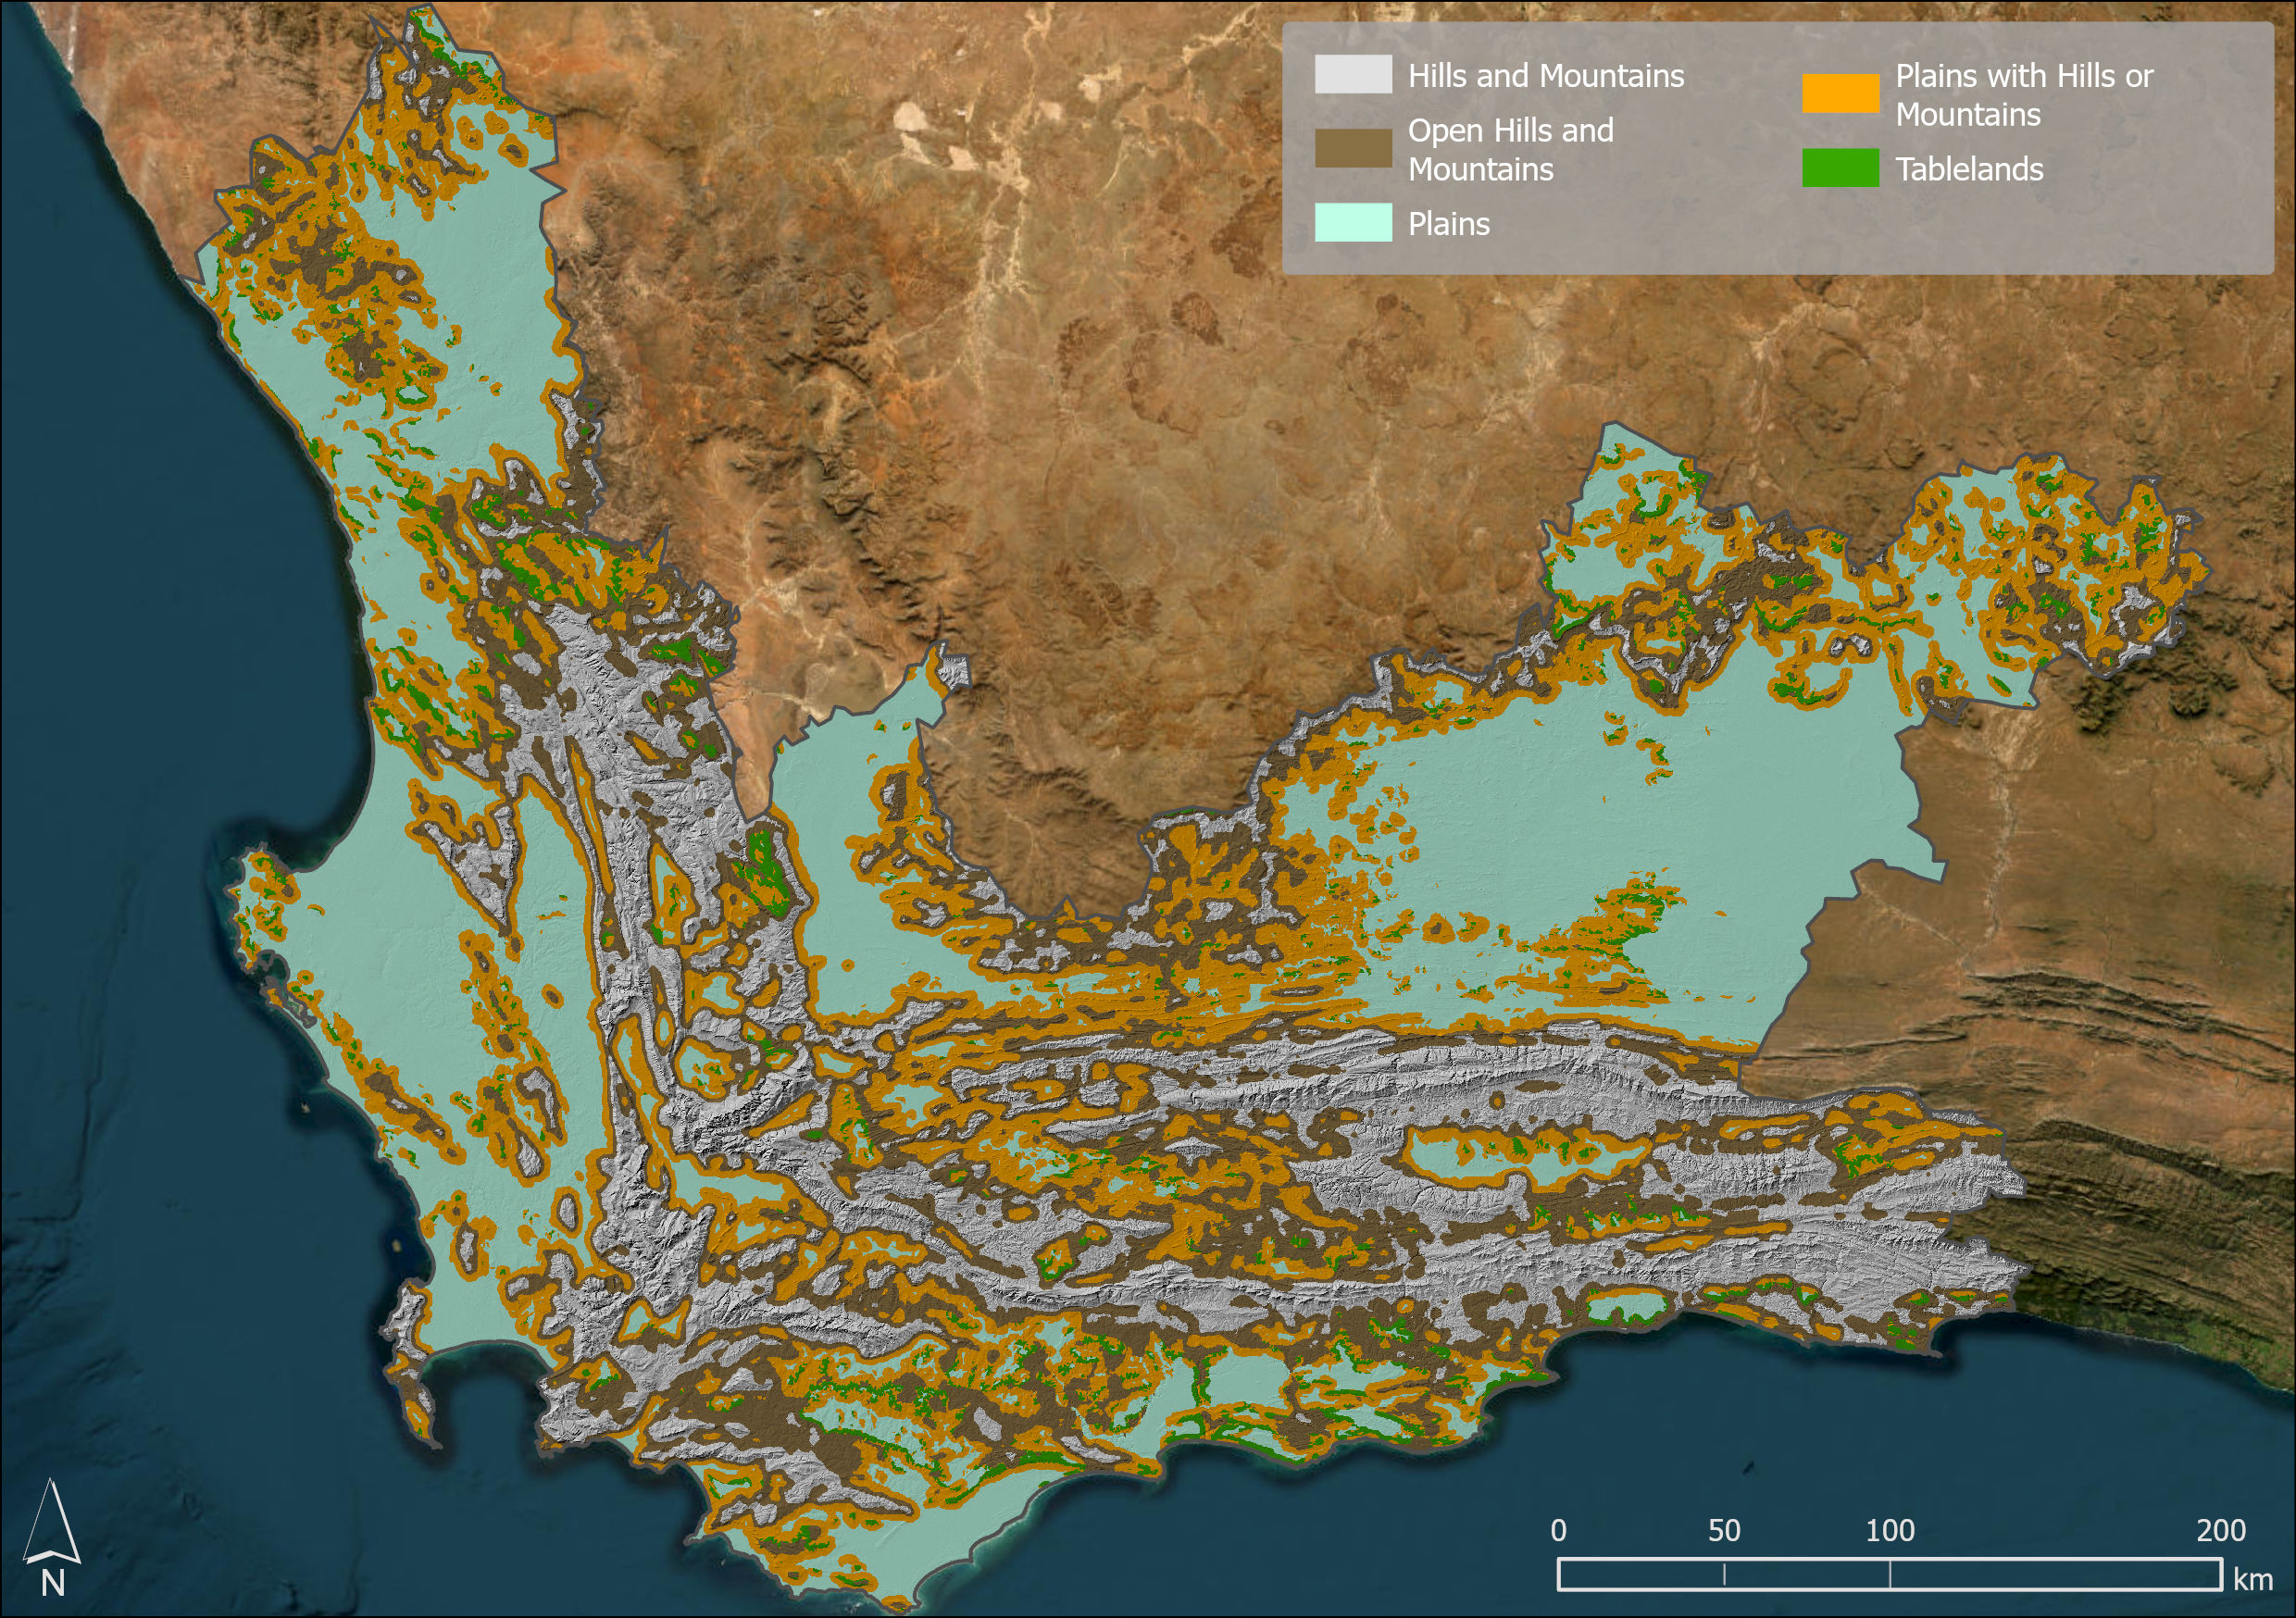
Landform classification of the Western Cape.
Landform classification has traditionally been done manually. Modern computing and high-resolution elevation data have made automated classification possible, but the accuracy of these automated approaches depends critically on the input data and the parameters used.
Landform classification: the process of systematically grouping the landscape into categories such as plains, hills and mountains, tablelands, and open hills and mountains
The study tested 40 different model configurations, combining four digital elevation model (DEM) sources at two spatial resolutions and five analysis window sizes. The DEM sources tested were three widely used global products, namely ALOS (AW3D), ASTER, and SRTM, as well as SUDEM, Geosmart’s locally produced and nationally calibrated elevation model.
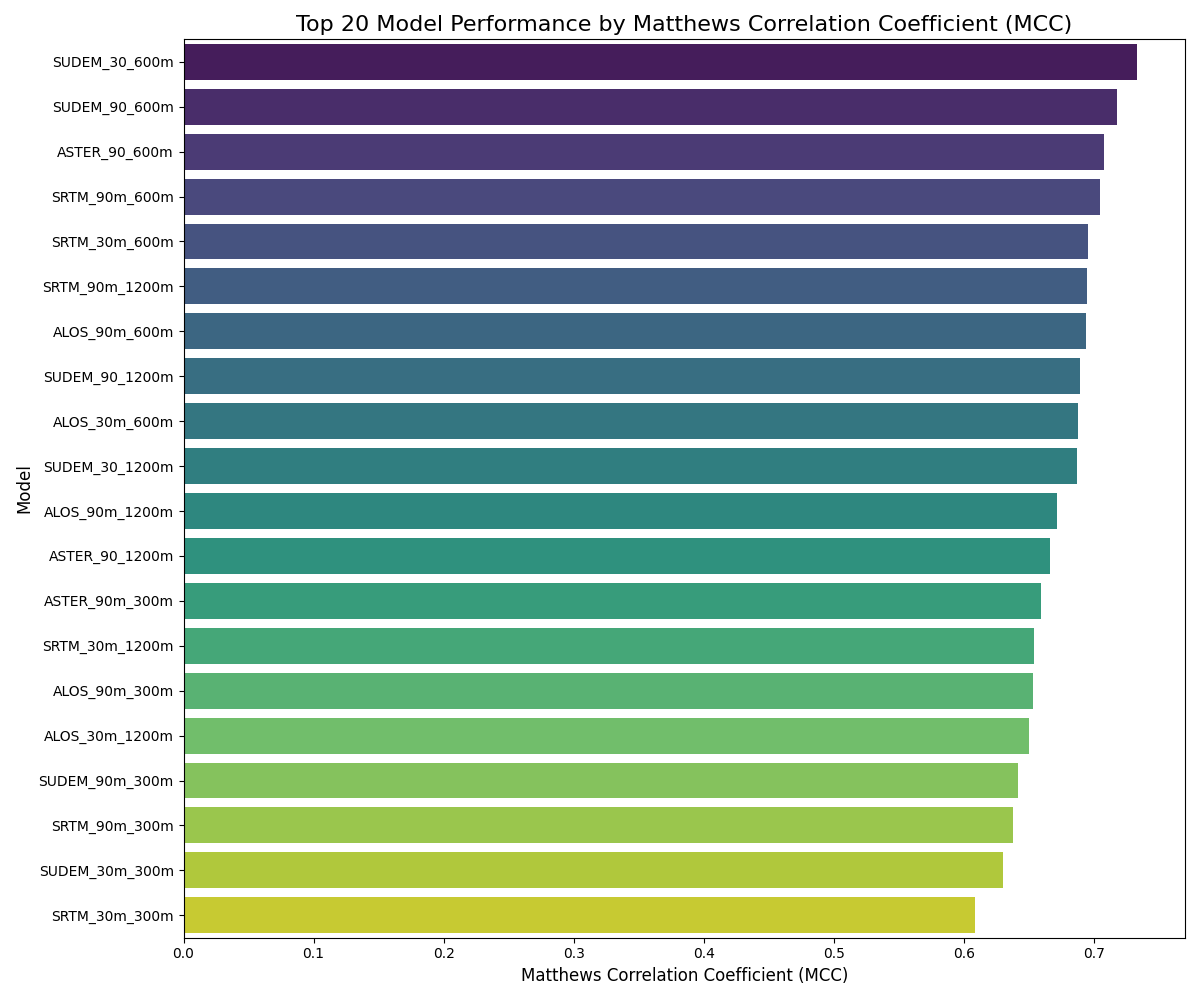
Top 20 model performers with SUDEM as the clear top contender.
The results showed that SUDEM consistently outperformed all three global alternatives, achieving the highest classification accuracy across nearly every configuration tested. The optimal model (SUDEM at 30-metre resolution with a 600-metre analysis window) correctly classified 82.3% of expert-validated reference points, with a Matthews Correlation Coefficient of 0.734. SRTM performed second, while ASTER produced the least reliable results, likely due to stereo-matching artefacts that introduce noise in complex terrain.
The study also revealed a counterintuitive finding: coarser 90-metre resolution models generally outperformed their 30-metre counterparts on average across the full model set. Higher-resolution inputs tend to amplify micro-topographic noise, which can confuse landform-scale classification. SUDEM at 30 metres was the notable exception, where the quality of the underlying data was sufficient to overcome this tendency, confirming that data quality matters more than resolution alone.
This optimal SUDEM-based classification delivered the first comprehensive, province-scale automated landform map of the Western Cape. This dataset now forms a foundational geospatial layer for a range of environmental and hydrological applications.
Terrain and Water Use: A Measurable Relationship
With a reliable landform map in hand, the study turned to its central ecological question. Monthly evapotranspiration (ET) data from the FAO’s WaPOR satellite-derived dataset (2021–2023) were combined with the 2022 South African National Land Cover map to analyse water use across 20 unique vegetation-landform combinations. Evapotranspiration is the primary pathway through which vegetation returns water to the atmosphere, and is therefore a critical variable in water resource management.
Evapotranspiration — the combined water loss from evaporation and plant transpiration
The analysis found that vegetation type is the dominant control on water use, accounting for roughly half of all variability in ET across the province. Planted commercial forests were by far the highest water consumers, averaging 59.35 mm per month, which was more than double the rates recorded for natural shrublands and grasslands (approximately 23–25 mm per month). Natural wooded land fell between these extremes at around 50 mm per month.
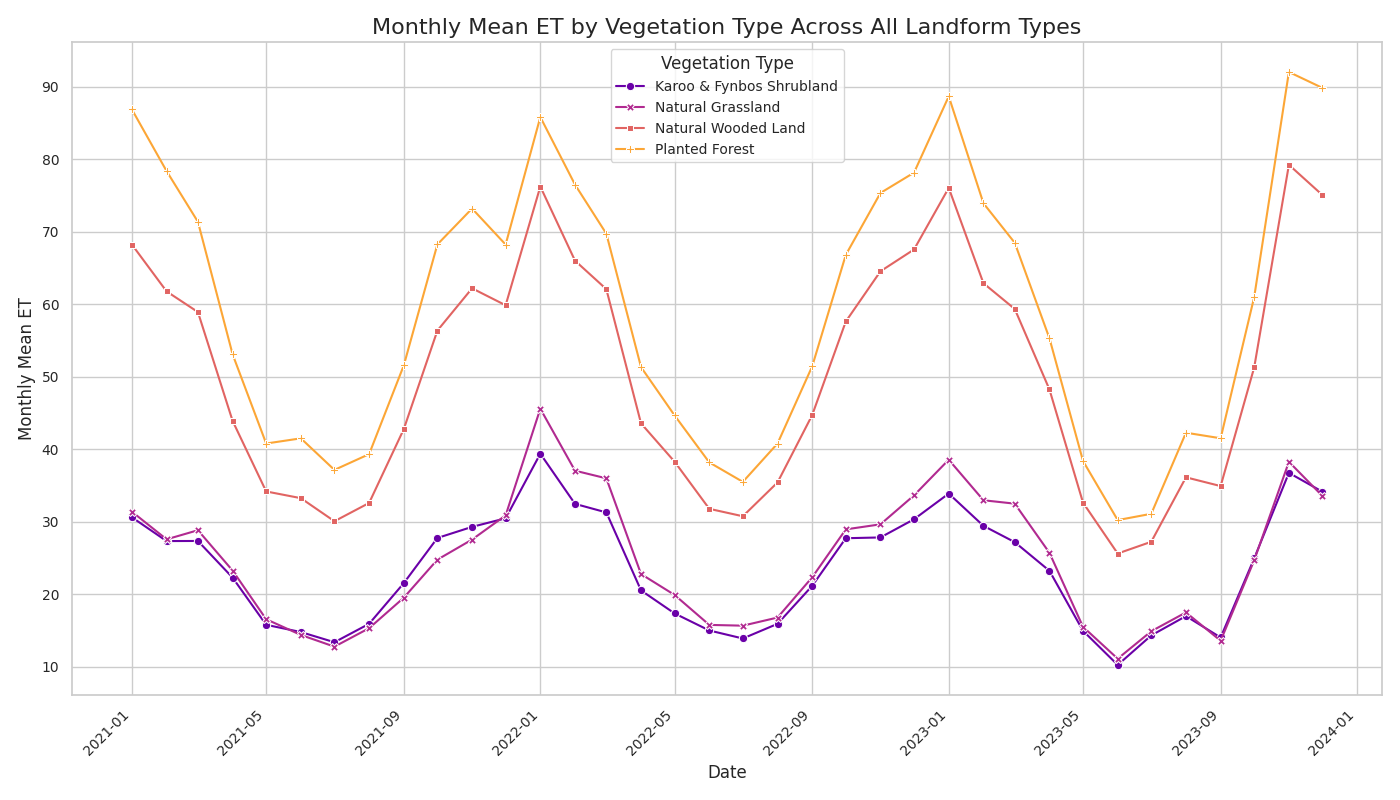
Mean monthly evaporation showing plantation forests using considerably more water than other vegetation types.
But terrain also has an impact. After accounting for vegetation type, landforms exerted a statistically significant secondary effect on evapotranspiration. Hills and mountains averaged 48.50 mm per month across all vegetation types, compared to just 32.06 mm per month on plains, which is a difference of approximately 30%. This topographic amplification operates through several mechanisms:
- mountains typically receive more rainfall through orographic lifting
- soils in complex terrain tend to hold more moisture in certain positions
- elevation-driven microclimatic effects alter temperature and humidity at the canopy level
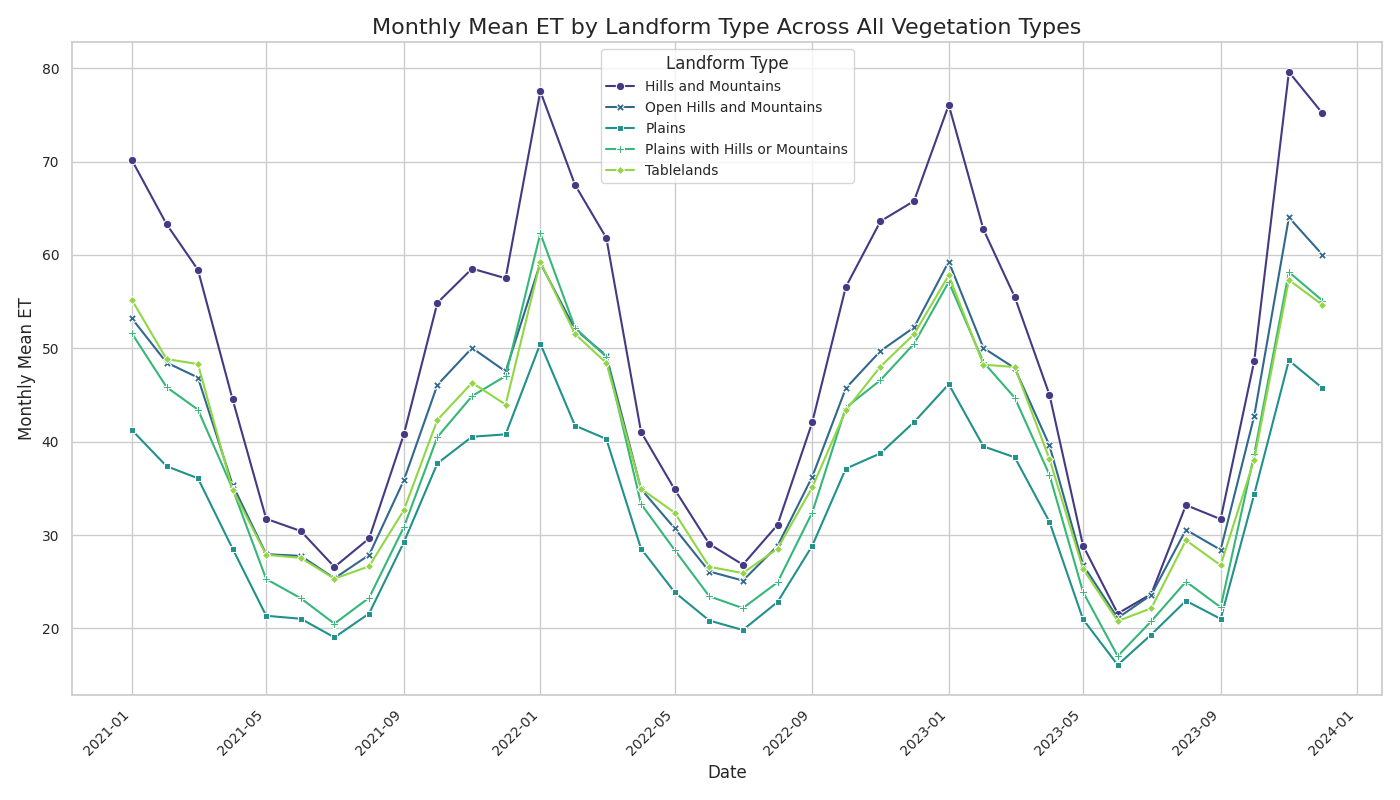
Mean monthly evaporation showing how an increase in terrain complexity impacts the water usage of vegetation.
The interaction between these factors followed an additive pattern. Each vegetation type used more water in more complex terrain than on flat ground, and the effect was most pronounced in forests. Planted forests on hills and mountains recorded the highest ET values in the entire province, while the same forest type on plains showed a measurable reduction in water use.
Practical Implications for Land and Water Management
These findings have direct relevance for one of South Africa’s most contested land use debates: the placement of commercial forestry plantations. South African legislation already recognises plantation forests as a “streamflow reduction activity,” given their well-documented effect on catchment water yields. This research adds a spatial dimension to that understanding.
The data show clearly that the water cost of a plantation forest is not fixed; it depends substantially on where that forest is located. A plantation on a mountain or in a rugged catchment will use more water than the same plantation on a flat lowland. Given that the Western Cape’s mountainous areas are already water-scarce and that their hydrology is dominated by surface runoff from steep terrain, placing high water-consuming forests in these landscapes represents a compounded risk.
The study’s recommendation is straightforward: afforestation planning should prioritise plains and lower-relief areas, where the same vegetation uses less water, and the hydrological trade-offs are more manageable. Conversely, water-stressed mountainous terrain, which is already under pressure from climate change projections pointing to drier winters across the Western Cape, warrants particularly careful consideration before large-scale planting.
Looking Ahead
The landform classification developed in this research lays the groundwork for a range of further applications. The SUDEM-derived provincial terrain dataset can serve as a baseline for soil mapping, flood risk assessment, ecological connectivity analysis, and refined hydrological modelling. Future research could extend the ET analysis over longer time periods to capture drought effects, incorporate additional variables such as soil type and groundwater, and test adaptive classification approaches that adjust analysis scale based on local terrain complexity.
What this work makes clear is that the shape of the land is not a passive backdrop to ecological and hydrological processes; it is an active participant in them. Getting the terrain data right, with the precision and local calibration that products like SUDEM provide, is therefore not only a technical preference. It is the foundation on which sound environmental decisions are built.
Link to the research can be found here.