
Add value to your dataset
Elevation datasets are merely providing height above sea level values across an area. However, to truly unlock the potential of your terrain data, it’s essential to uncover the diverse attributes inherent to your landscape. Our suite of derived products extends beyond elevation models, delivering high-quality terrain attributes guaranteed to be a value-add to the product, your order, and your analysis.
Explore some of our most popular derivatives, available as add-ons to your elevation model, below.
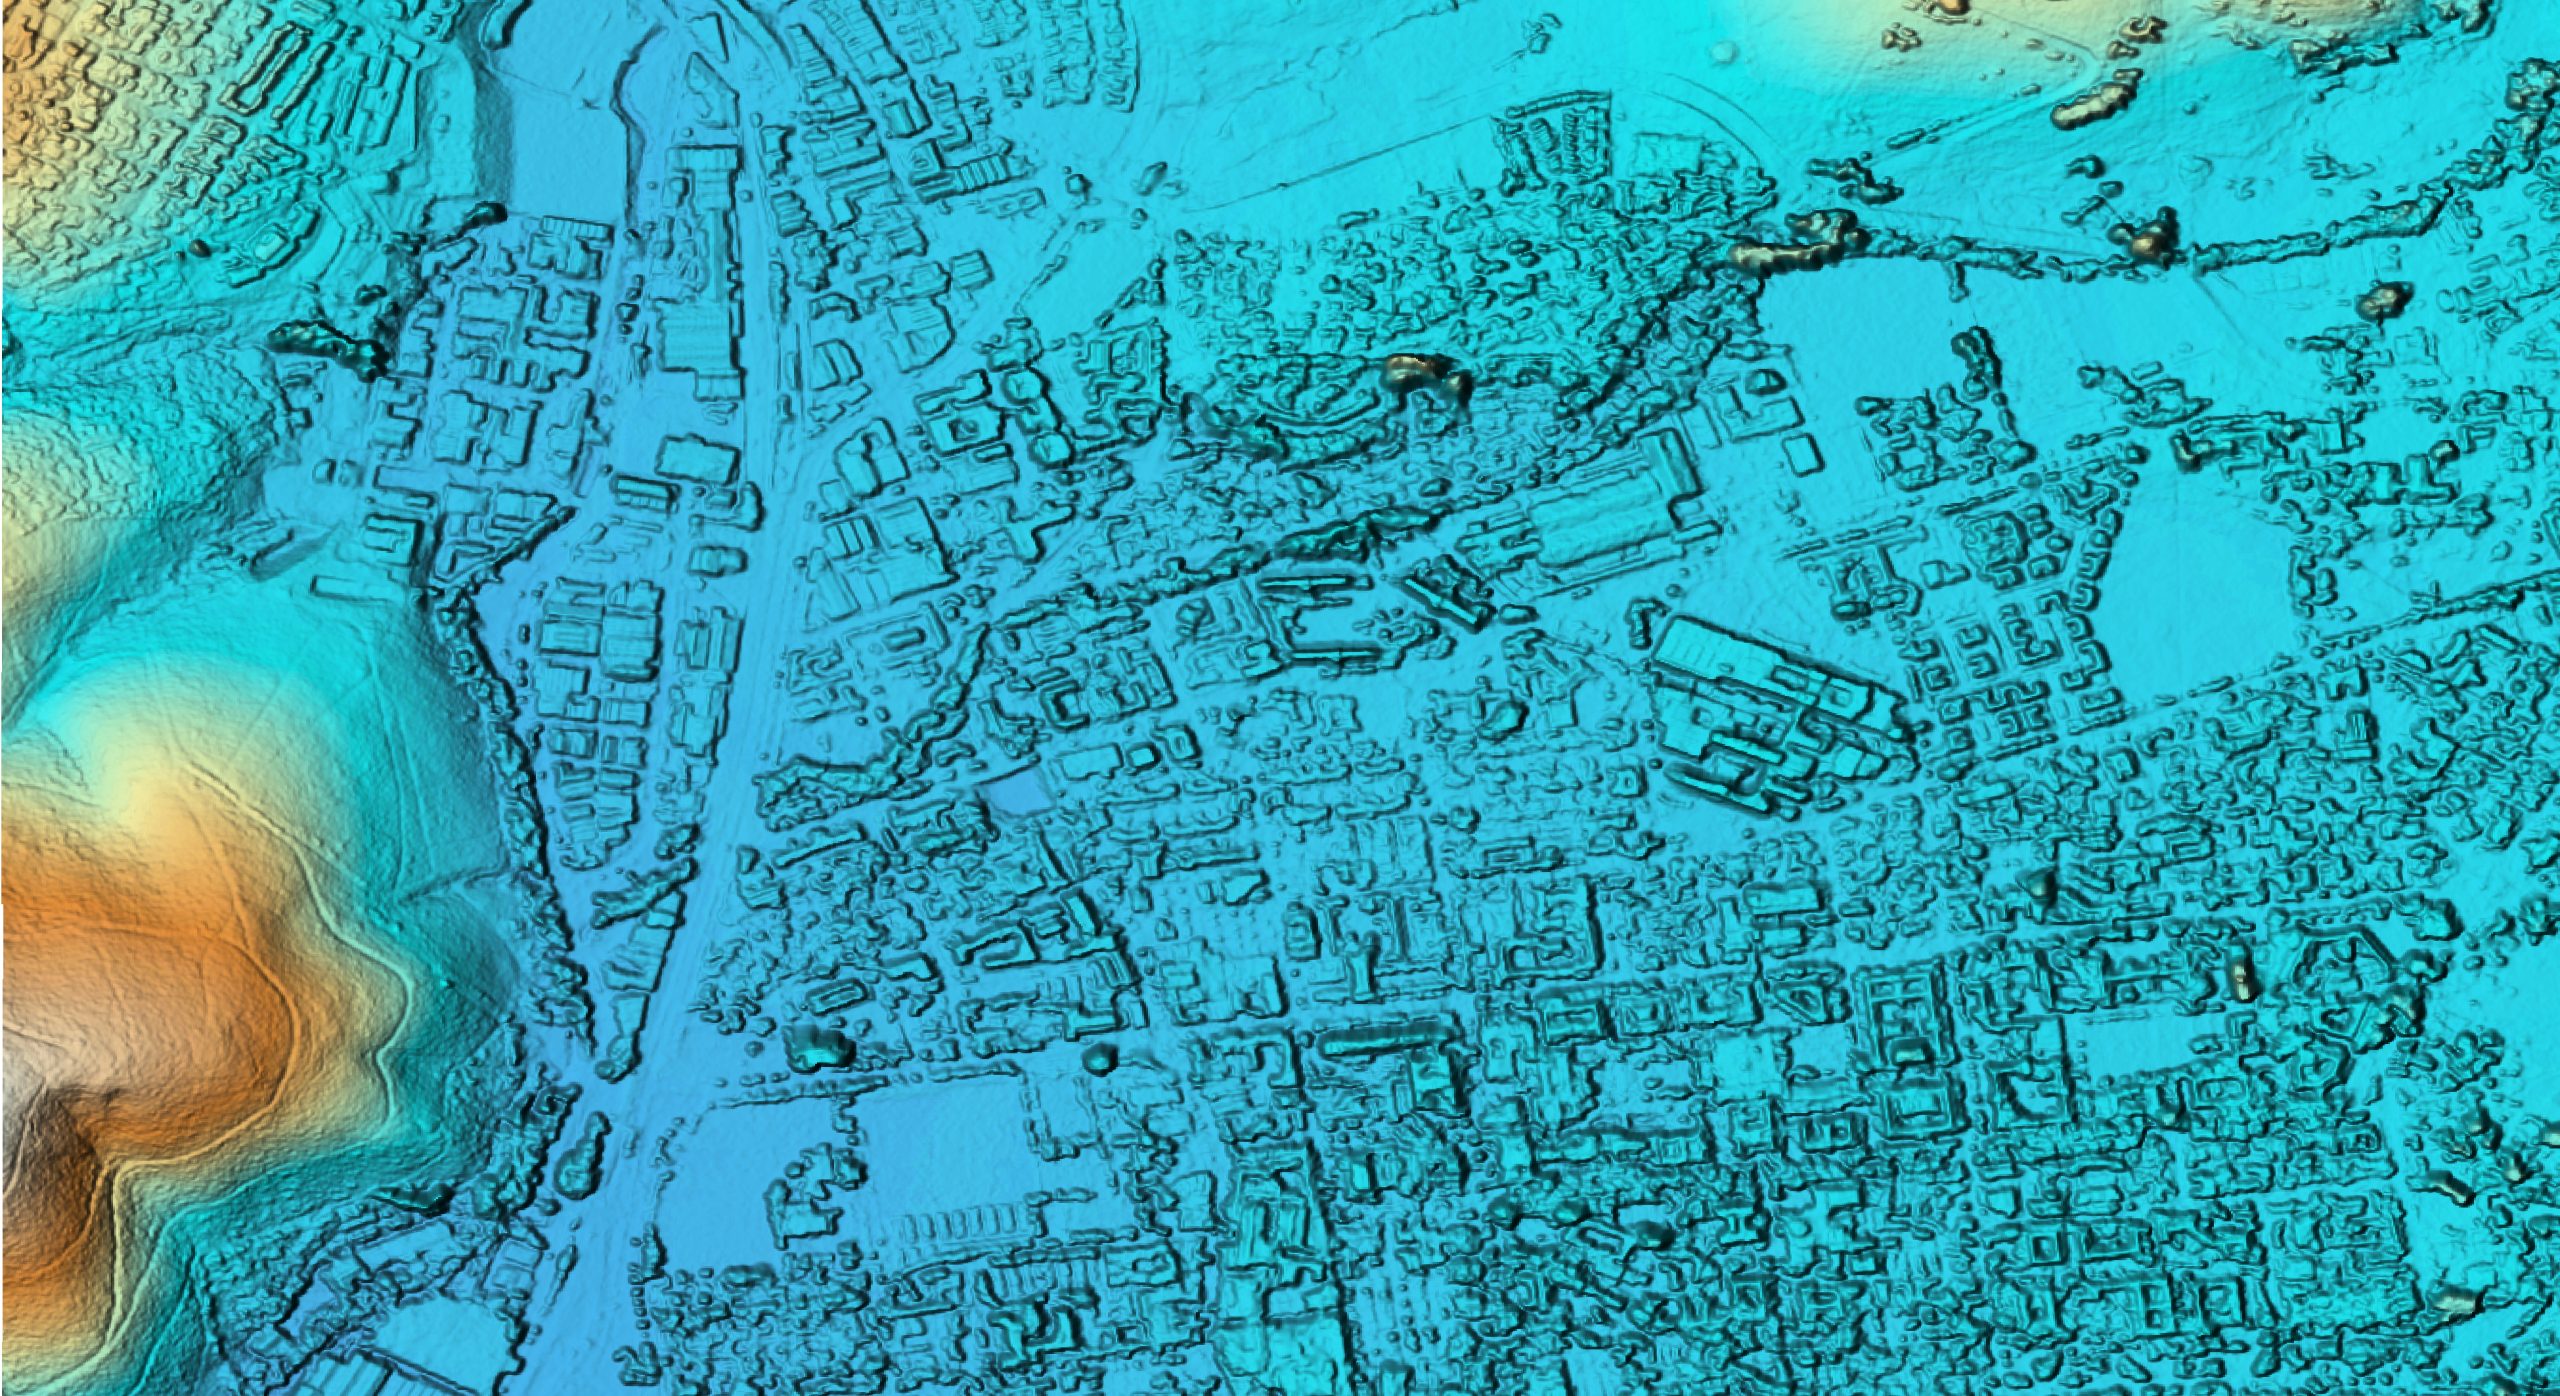
Hillshade
Terrain can be visualised in various ways. The most realistic-looking visualisation is called a hillshade. The sun’s azimuth (horizontal angle) and altitude (vertical angle) are modelled to show terrain variation by simulating shadows and shading on the terrain.
This can be supplemented with colours varying with elevation (hypsometric tinting) to create a relief layer.
- Visualization
Hillshades provide a visually appealing representation of terrain, enhancing the understanding of landforms and surface characteristics. They can be used to create 3D-like visualizations of landscapes or to enhance map aesthetics.
- Terrain Analysis
Hillshades help identify slope aspects and terrain features such as ridges, valleys, and peaks. They assist in analyzing landforms, land cover relationships, and drainage patterns. For example, they can be used to identify areas of potential solar radiation exposure or to study erosion-prone regions. - Cartography
Hillshade derivatives are commonly used in cartography to add depth and visual appeal to maps. They can be combined with other map layers, such as land cover or hydrological features, to create visually informative and aesthetically pleasing representations. - Visualization of Infrastructure
Hillshades can aid in infrastructure planning and visualization. By overlaying hillshade images with transportation networks, buildings, or utility infrastructure, one can assess the suitability of locations, identify potential visibility issues, or analyse line-of-sight constraints. - Environmental Modelling
Hillshades can be used as input in environmental modelling processes, such as viewshed analysis, where visibility from specific locations is assessed. They help understand the visual impact of landscape changes or the potential visibility of sensitive areas

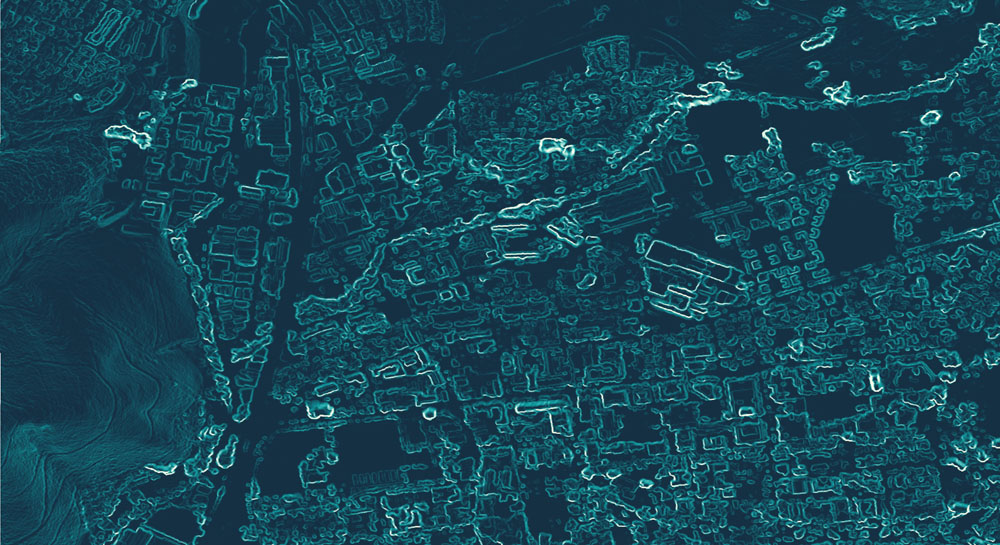
Slope
Slope (gradient) shows the rate of change of elevation over a specific horizontal distance. It quantifies how quickly or gradually the elevation of the land surface changes as you move from one point to another usually measured as a percentage or angle.
When measured in degrees it can range from 0° to 90°. Slope percentage is calculated by dividing rise (vertical change) over run (horizontal change) so it can then range from 0% to infinity (technically).
- Civil engineering and construction
Slope analysis helps in designing roads, railways, and embankments, ensuring proper drainage, and identifying potential stability issues. - Environmental Sciences
Slope analysis is used in understanding erosion patterns, soil stability, and landform classification. - Water management
Slope information is essential for hydrological modelling, predicting water runoff, and designing irrigation systems. - Recreation and outdoor activities
Slope data is used by hikers, skiers, and mountain bikers to assess the difficulty and safety of trails and slopes
Aspect
Aspect refers to the compass direction or orientation of a slope or terrain surface. It provides information about the direction a slope faces or is inclined. Aspect is typically measured in degrees, representing the angle between the slope direction and north.

- Hydrology
Aspect influences the distribution of solar radiation, which affects temperature, evaporation, and snowmelt patterns. It is important in hydrological modelling, especially for understanding water flow, drainage patterns, and snow accumulation and melt. - Ecological studies
Aspect affects the microclimate of a slope, influencing vegetation growth, species distribution, and ecological processes. It is used to study habitat suitability, plant community dynamics, and wildlife behaviour. - Land management and agriculture
Aspect information helps in site selection for agricultural crops, vineyards, or orchards, considering factors such as sunlight exposure, frost risk, and temperature variations. - Renewable energy planning
Aspect is relevant in assessing the potential for solar energy generation by identifying areas with optimal solar exposure and orientation for solar panels or solar farms.

Curvature
Curvature is a derivative obtained from Digital Elevation Models (DEMs) that provides information about the shape and curvature of the terrain surface. It describes how the elevation of the land changes in different planar axes, indicating the convexity or concavity of the landscape at each location.
Curvature is calculated by analysing the slope rate of change of slope across a given DEM. It quantifies the curvature of the terrain surface based on the second derivatives of the elevation values in the x and y directions.
Types of curvature

Profile Curvature: Profile curvature represents the curvature of the terrain in the direction of the steepest slope or the profile line. It indicates whether the terrain is concave (valley-like) or convex (ridge-like) in the direction of the profile.
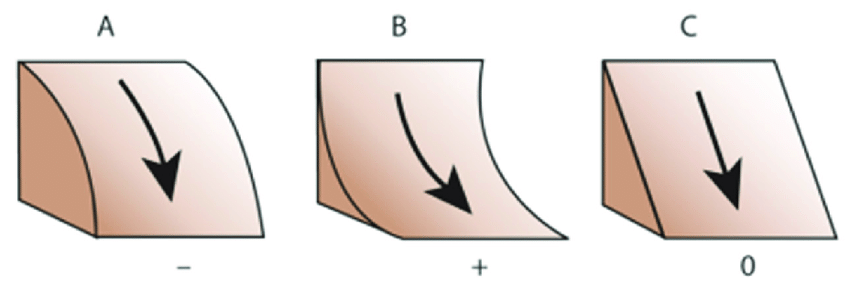
Plan Curvature: Plan curvature represents the curvature of the terrain perpendicular to the steepest slope or the plan view. It indicates whether the terrain is concave or convex when viewed from above.
- Landform Classification:
Curvature derivatives help in classifying landforms and identifying terrain features such as ridges, valleys, slopes, and plains. By analysing the curvature values, one can distinguish between convex and concave areas and better understand the topographic characteristics of the landscape. - Erosion and Sediment Transport:
Curvature derivatives are used to analyse erosion patterns and sediment transport. Concave areas with negative curvature values tend to accumulate sediments, while convex areas with positive curvature values are prone to erosion. - Hydrological Analysis:
Curvature derivatives are employed in hydrological modelling and watershed analysis. They help identify flow patterns, channel networks, and drainage directions by analysing the curvature values along the terrain. - Landscape Visualization:
Curvature derivatives can be used to create visually interesting representations of the terrain surface. By applying colour ramps or shading techniques to the curvature values, one can highlight the variations in curvature and enhance the visualization of landforms. - Terrain Stability Assessment:
Curvature derivatives are useful in assessing terrain stability and slope stability analysis. Areas with high positive or negative curvature values may indicate regions prone to landslides or instability.

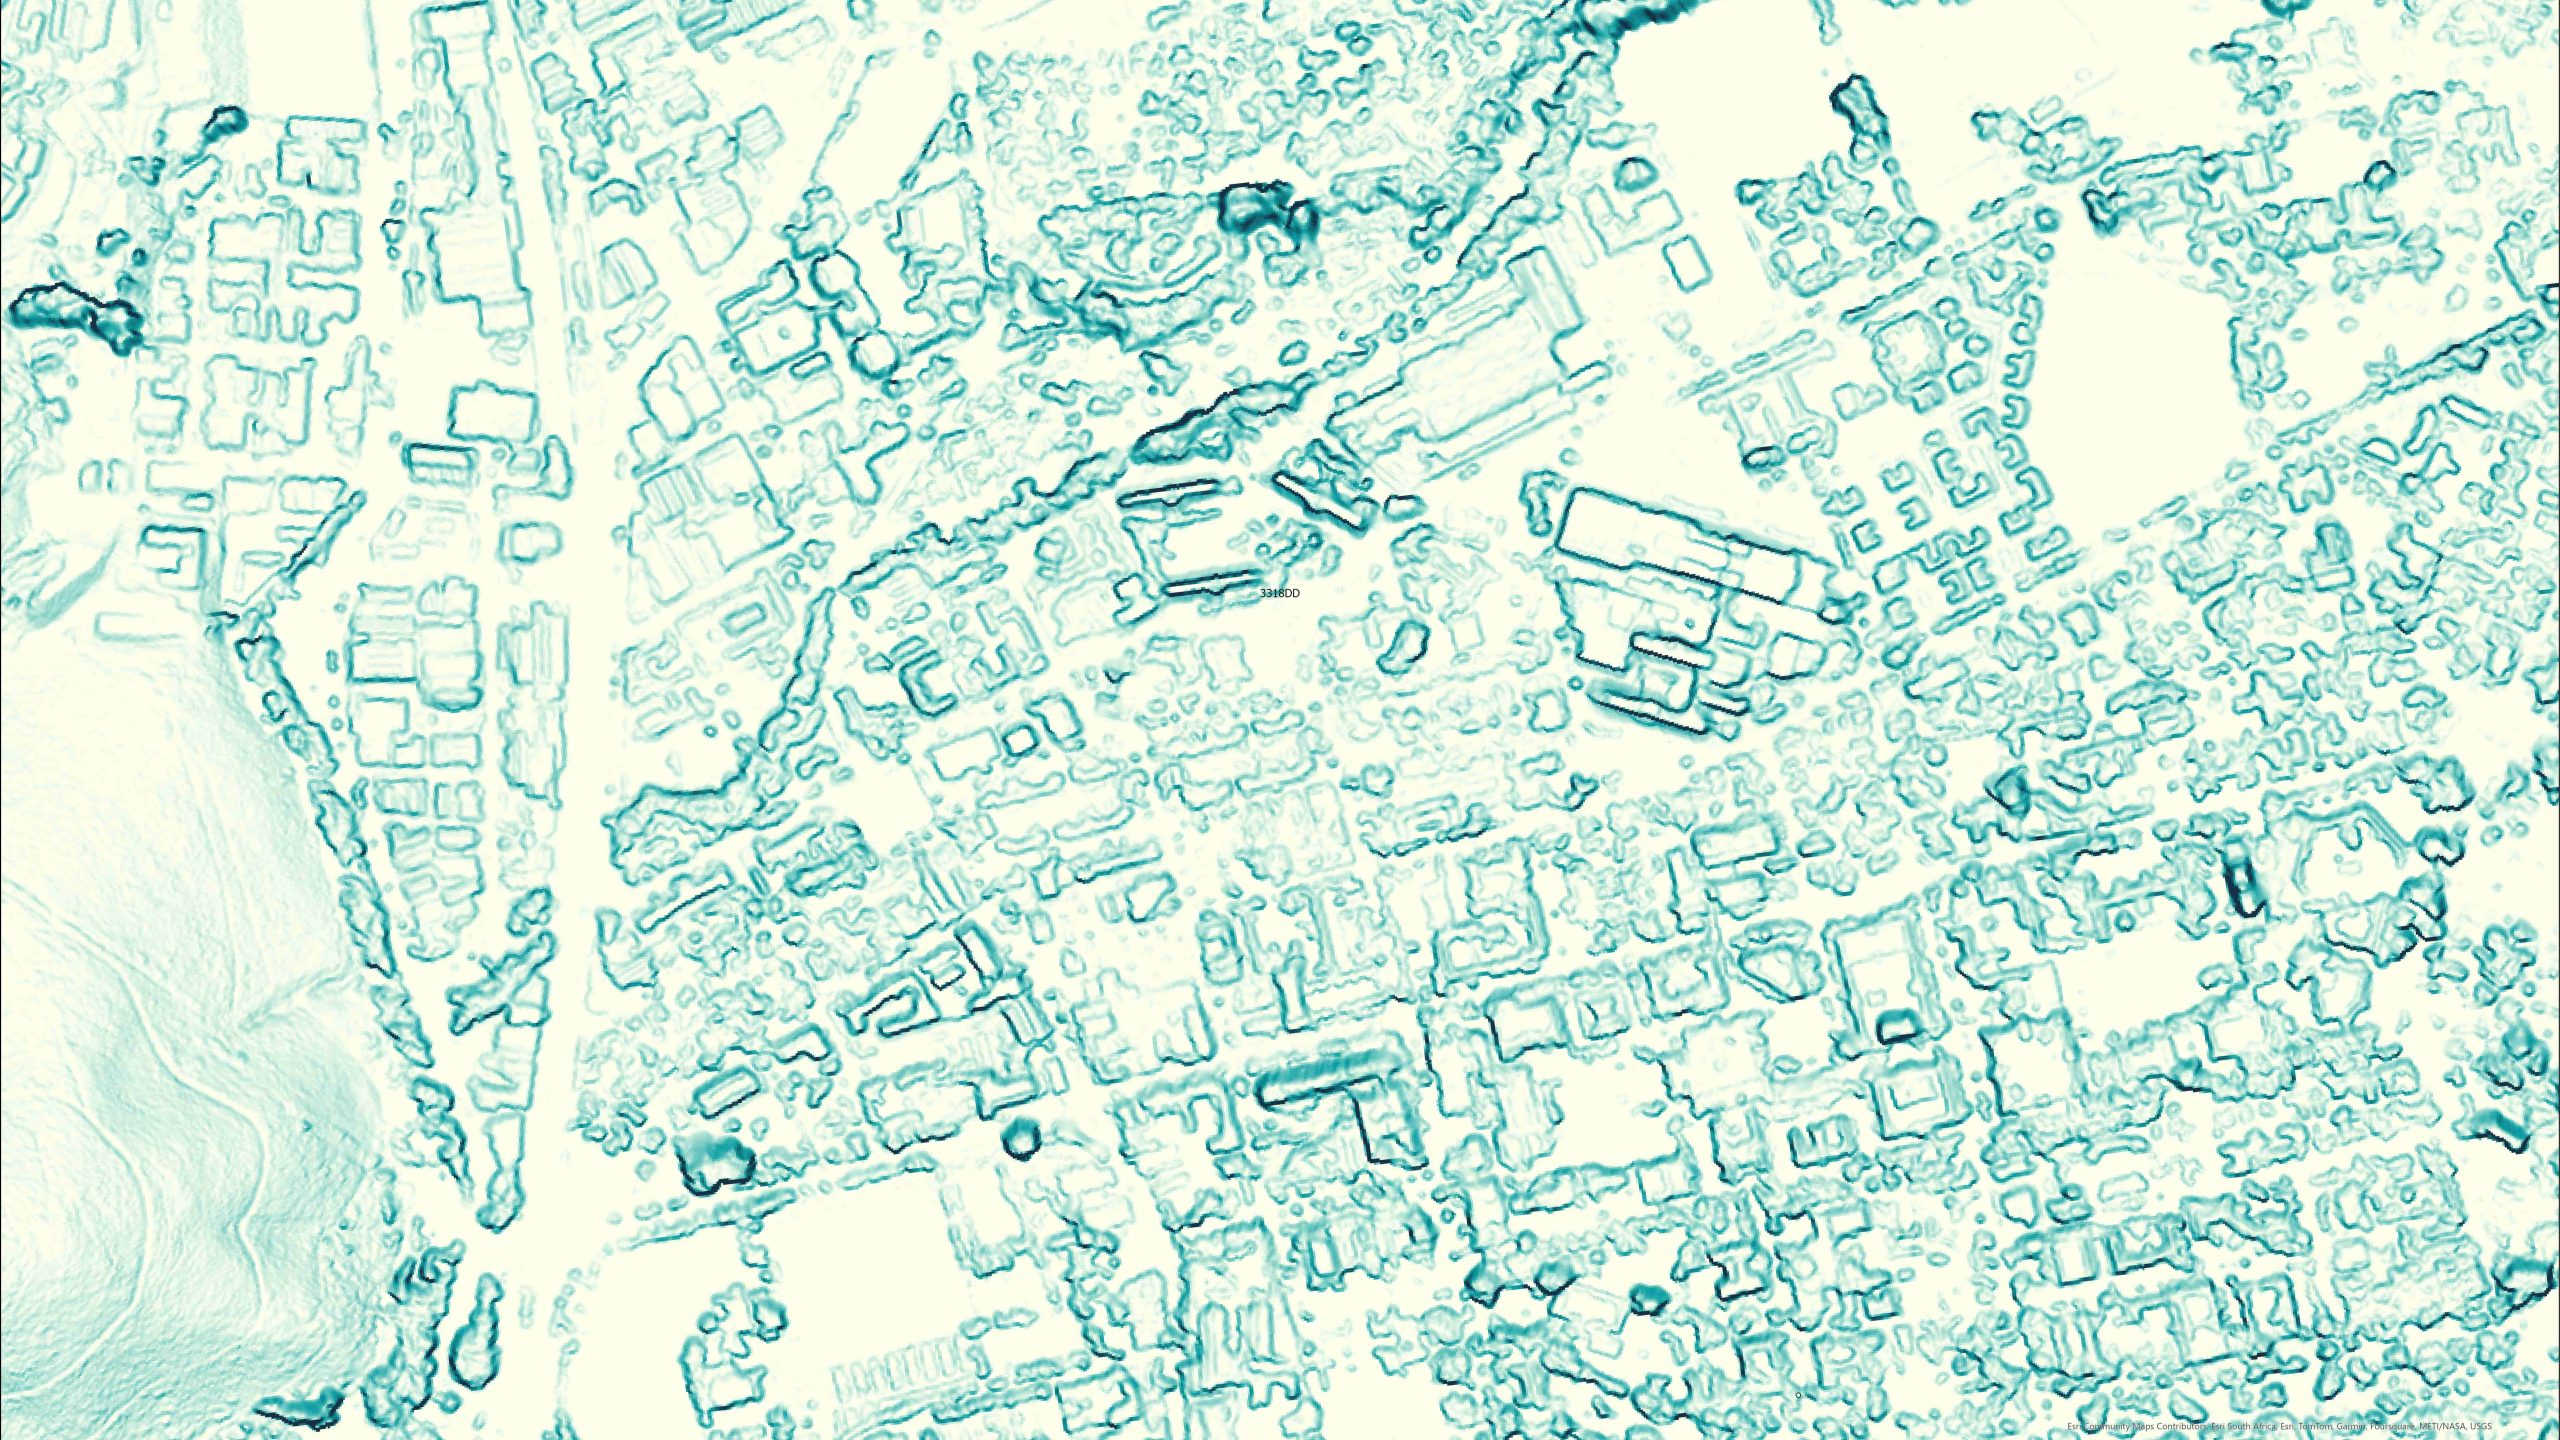
Topographic Positioning Index (TPI)
The Topographic Positioning Index (TPI) calculates the relative elevation of a specific location within a landscape. It calculates the difference between a central cell’s elevation in a DEM and the average elevation of its neighbouring cells.
This index provides valuable insight into local topography and helps classify terrain features like valleys, ridges, and flat areas.
Understanding TPI Values:
- Positive TPI Values: A positive TPI value indicates the central cell is positioned higher than its surrounding area. Higher values typically correspond to ridges, hillslopes, or local highs.
- Negative TPI Values: Negative TPI values signify the central cell is positioned lower than its surrounding cells. These areas are likely valleys, depressions, or channels within the terrain.
- Values Around Zero: Values close to zero represent relatively flat terrain with minimal elevation difference compared to neighboring cells.
- Landform Classification: TPI plays a crucial role in automatically classifying different landforms within a landscape. By analysing the relative elevation of each cell, it helps identify areas like valleys, ridges, slopes, plateaus, and depressions.
- Hydrological Applications: Understanding terrain position is beneficial for hydrological modelling. TPI can be used to predict water flow patterns, potential drainage areas, and locations prone to water accumulation.
- Vegetation Analysis: The distribution of vegetation is often influenced by topography. TPI can be used to identify areas with specific drainage patterns or moisture availability, which may correlate with specific plant communities.

Topographic Ruggedness Index (TRI)
The Topographic Ruggedness Index (TRI) is a quantitative measure to assess underlying terrain’s relative roughness or complexity. It analyses the elevation changes between neighbouring cells within a DEM to create a spatially explicit index value for each location.
How TRI Works:
TRI calculates the average squared difference in elevation between a central cell and its surrounding cells (usually eight in a square neighborhood). By squaring the elevation differences, the impact of larger variations in height is emphasised. The square root of this average is then taken to arrive at the final TRI value. Higher TRI values indicate a more rugged terrain with significant elevation changes, while lower values represent flatter or smoother surfaces.
- Habitat Suitability Analysis: TRI can help identify areas suitable for specific wildlife species. Some animals prefer flatter areas, while others thrive in rugged terrain.
- Hydrological Modelling: TRI can be used to assess potential water flow patterns, erosion risk, and stream development. Rugged terrain with higher TRI values may influence runoff and affect flood risk.
- Land Use Planning: Understanding terrain complexity can aid in informed land-use decisions. Steep slopes with high TRI values might pose challenges for infrastructure development or agriculture.
- Landslide Susceptibility Mapping: Areas with high TRI values can be more susceptible to landslides, aiding in risk assessment and mitigation strategies.
Estimate Cost and Request a Quote
Complete the form and we’ll be in touch as soon as possible.
Step 1: Select Product
Step 2: Specify Area of Interest (AOI)
Step 3: Inspect Price Estimation
Product Cart
| AOI Name | Product | AOI Area | Price per km² | Processing Fee | Total Price (Excl. VAT) | Total Price (Incl. VAT) | Actions |
|---|
Summary
| Subtotal (Excl. VAT): | R 0.00 |
| VAT (15%): | R 0.00 |
| Grand Total (Incl. VAT): | R 0.00 |
For large orders (>5 000 km2), please contact us directly as such orders are often heavily discounted.