
FHI: Precision Flood Risk Mapping
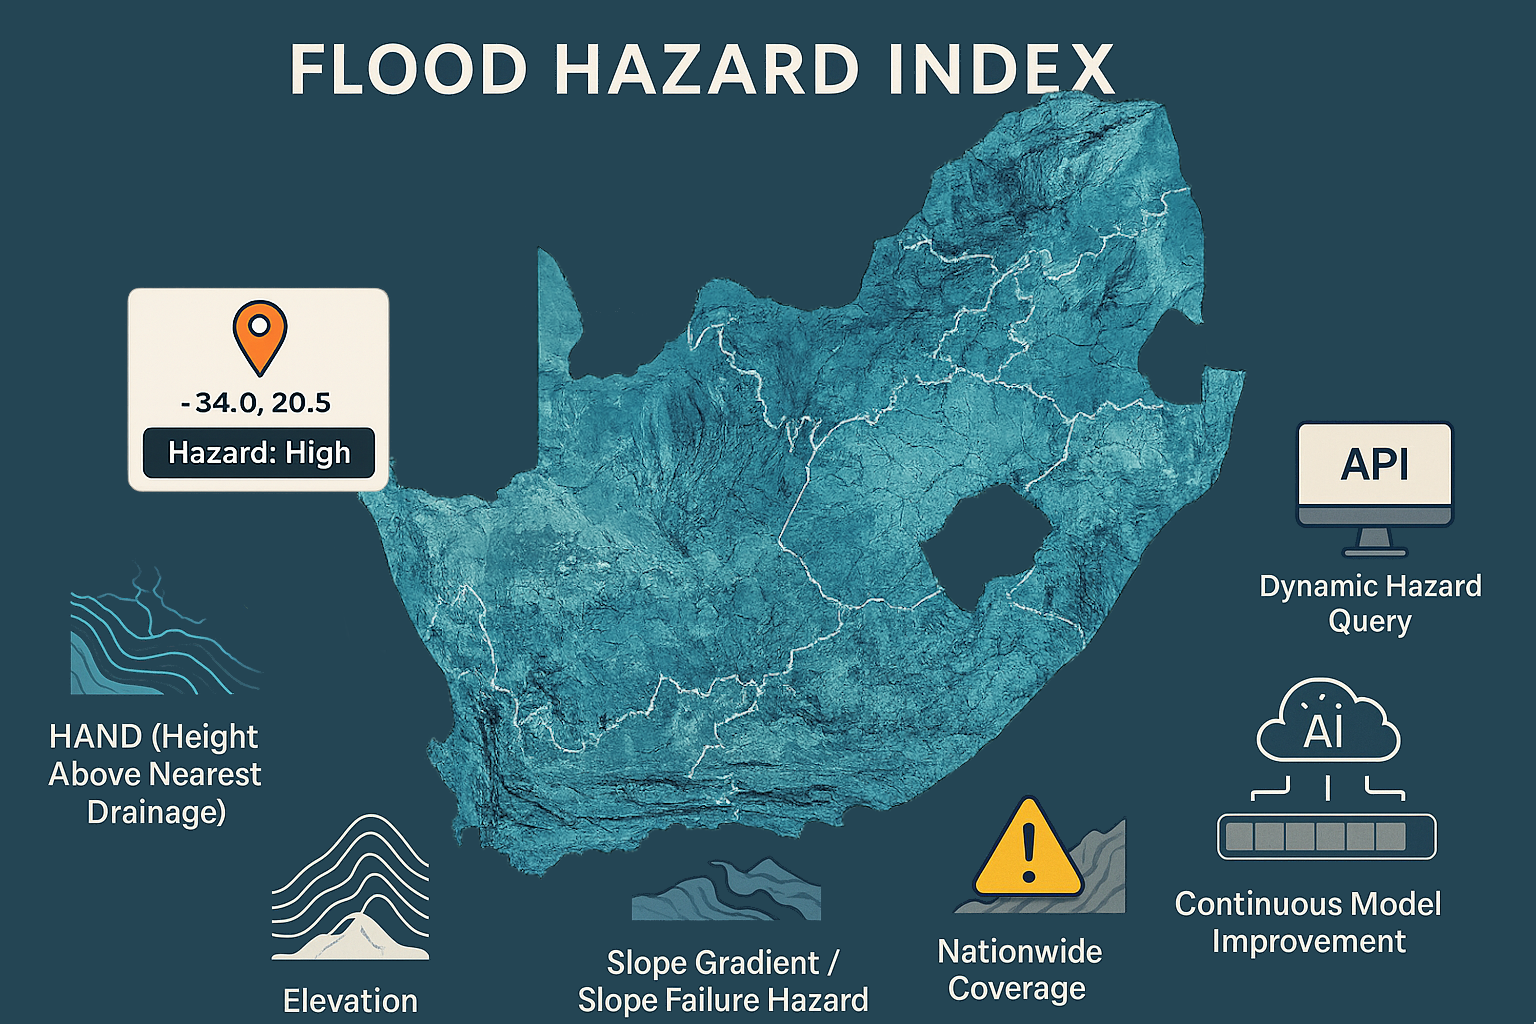
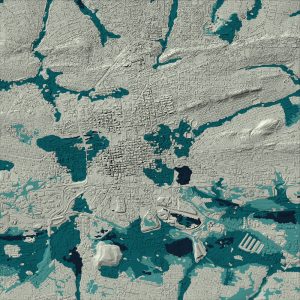
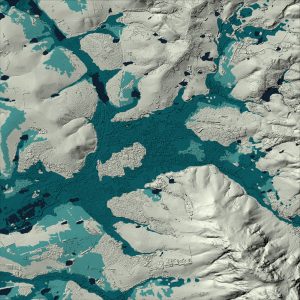
Flooding is on the rise globally. GeoSmart, in collaboration with the Centre for Geographical Analysis (CGA) at Stellenbosch University, has developed a Flood Hazard Index using machine learning and high-resolution terrain data (SUDEM5, DEMSA2). Trained on 2D hydrological models, the model identifies flood-prone areas with 84% accuracy.
Flood Hazard Index (FHI) – Available in:
-
Raster
-
Polygon
-
Point based values
Used by disaster managers, insurers, urban planners, and engineers.
Powerful. Scalable. Ready for your region.
-
Nationwide Coverage: Accessible for any location across South Africa with high accuracy.
-
Clear Hazard Classification: Intuitive hazard levels — Acute, High, Medium, and Low — making risk interpretation straightforward.
-
Seamless Integration: Dynamic, real-time hazard queries via API for smooth computer-to-computer communication.
-
Flexible Queries: Retrieve hazard levels by precise coordinates (latitude & longitude) or by defined areas (polygons).
-
Enriched Data Layers: Includes additional metrics such as Elevation, Height Above Nearest Drainage (HAND), and Slope Gradient — crucial for assessing slope failure risks.
-
Adaptive Accuracy: Continuously enhanced precision as our machine learning model learns from new data, ensuring up-to-date hazard assessments.


Product Specification
| Resolution | 5 m |
| Format | GeoTIFF (tif), Shapefile (shp), CAD (dwg or dxf) |
| Price | See pricelist below |
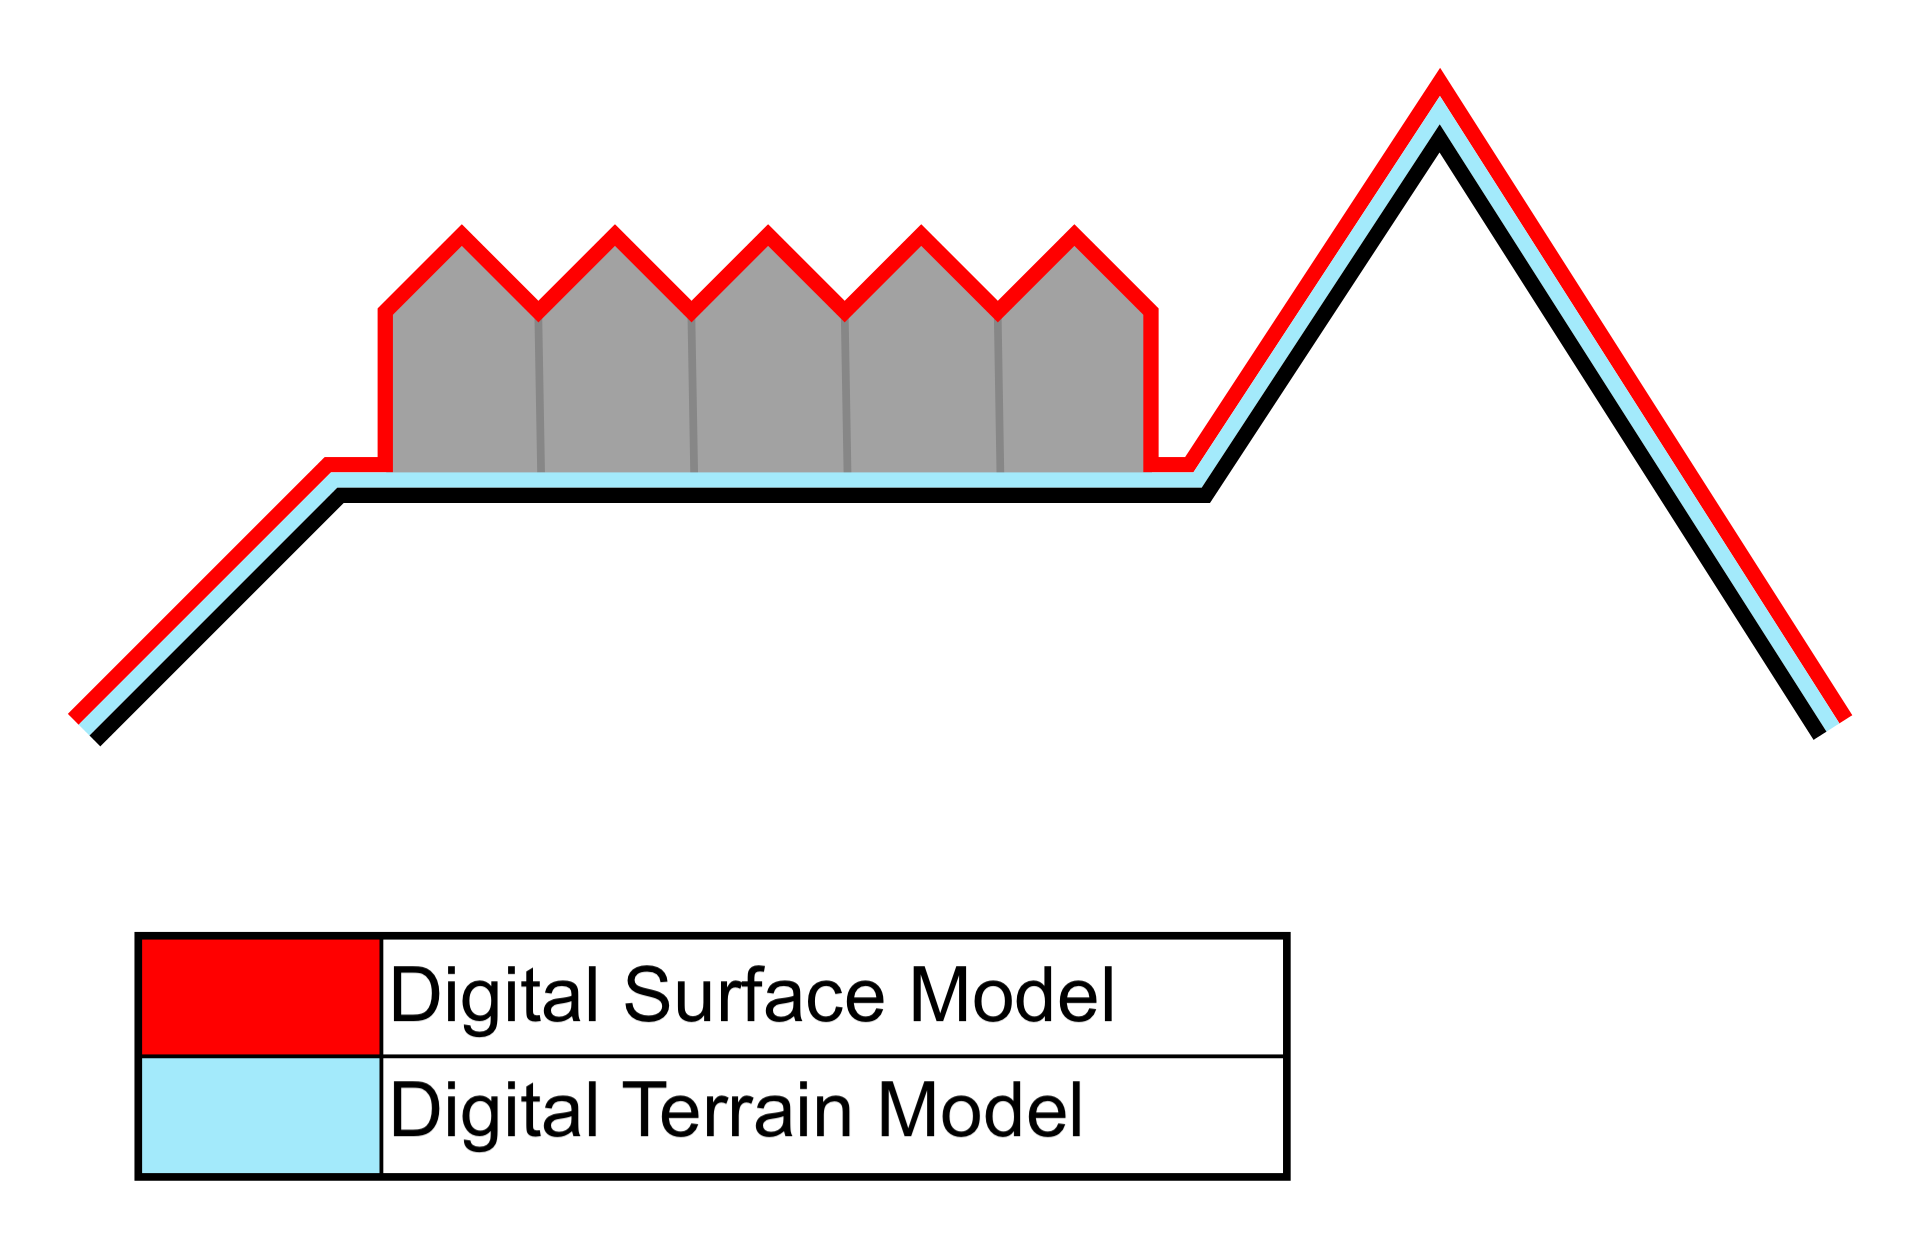
The flood hazard index is derived from our DEMSA2 products. Depending on the product ordered, this can be either from a digital terrain model (DTM) or a digital surface model (DSM). In other words, the flood hazard index can be derived from only the bare earth elevation, or include the heights of objects (e.g. trees, buildings) on the earth’s surface as well. See the conceptual difference between a DTM and a DSM in this image:

Flood Hazard Index (FHI) – Advanced Flood Risk Mapping by GeoSmart and CGA
Floods are natural disasters that can lead to loss of life or the destruction of infrastructure and the natural environment. Recent studies have reported an increase in floods globally, with certain regions being more affected than others. This escalation has spurred advancements in flood mapping and monitoring technologies, leading to the development of innovative techniques for modeling these events.
GeoSmart, in collaboration with the Centre for Geographical Analysis (CGA) at Stellenbosch University, has developed a sophisticated flood hazard model that integrates digital elevation model (DEM) derivatives with machine learning algorithms. This model was trained using outputs from 2D hydrological simulations and a comprehensive set of terrain derivatives generated from high-resolution DEMs such as SUDEM5 and DEMSA2. Key predictors include Height Above Nearest Drainage (HAND), slope gradient, terrain wetness index, and flow accumulation. The resulting model achieves an accuracy of 84%, correctly predicting flood hazard levels in 84 out of 100 instances. (geosmart.space)
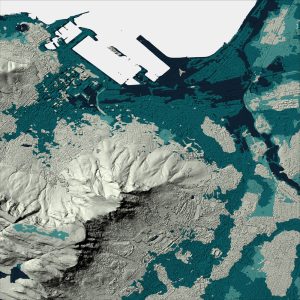
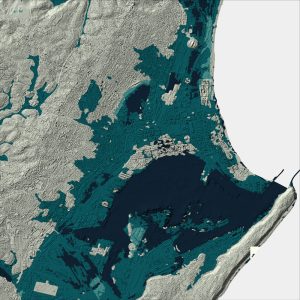
Initially implemented in 2016 for the Western Cape Province, the FHI has been instrumental in producing flood hazard maps that identify areas susceptible to flooding during extreme rainfall events. These maps are currently utilized by the Western Cape Disaster Management Centre for flood mitigation planning and disaster management. (geosmart.space)
The FHI is available in various formats to suit diverse applications:
- Raster Format: GeoTIFF (.tif) files for integration with GIS software.
- Vector Format: Shapefiles (.shp) and CAD files (.dwg or .dxf) for detailed spatial analysis.(geosmart.space)
- Tabular Format: Excel sheets containing cell values for statistical assessments.
Additionally, the FHI can be accessed via a dynamic API, allowing for real-time hazard queries based on specific coordinates or defined areas. The model’s accuracy is contingent upon the quality of the input DEM; thus, employing high-resolution datasets like SUDEM5 or DEMSA2 is recommended for optimal results. (geosmart.space)
GeoSmart’s FHI represents a significant advancement in flood risk assessment, offering a reliable and scalable solution for identifying flood-prone areas. Its integration of high-resolution terrain data with machine learning techniques ensures a robust and adaptable tool for various stakeholders involved in flood risk management.
For more information or to request FHI data tailored to your area of interest, please visit GeoSmart’s Flood Hazard Index page.
Pricing
| FHI Version | Derived from | Small area (< 400 km²) | Medium area (400 - 9 999 km²) | Large (> 10 000 km²) |
|---|---|---|---|---|
| Flood Hazard Index | DEMSA2 L1 (Raw DSM) | R2 700 per AOI + R45 per km² | R30 per km² | R25 per km² |
| FHI L2 Upgrade | DEMSA2 L2 (Quality Controlled DSM) | R3 300 per AOI + R75 per km² | R55 per km² | R50 per km² |
| FHI L3 Upgrade | DEMSA2 L3 (DTM) | R3 900 per AOI + R140 per km² | R110 per km² | R75 per km² |
| FHI SUDEM Upgrade | SUDEM (DEM) | R1 300 per AOI + R25 per km² | R25 per km² | R25 per km² |
*Turnover time will be lower for less complex terrain types. Drawing a bounding box square and not a complex boarder outline.
*Please enquire for a more accurate timeframe
*Areas of interest must be rectangular, with a minimum width of 1 km.
Contact Us: FHI Enquiry
Estimate Cost and Request a Quote
Complete the form and we’ll be in touch as soon as possible.
Step 1: Select Product
Step 2: Specify Area of Interest (AOI)
Step 3: Inspect Price Estimation
Product Cart
| AOI Name | Product | AOI Area | Price per km² | Processing Fee | Total Price (Excl. VAT) | Total Price (Incl. VAT) | Actions |
|---|
Summary
| Subtotal (Excl. VAT): | R 0.00 |
| VAT (15%): | R 0.00 |
| Grand Total (Incl. VAT): | R 0.00 |
For large orders (>5 000 km2), please contact us directly as such orders are often heavily discounted.