
Topographic Position Index
Reading the landscape at different scales: TPI from DEMSA2
A road embankment, a building and a ridgeline can all stand above their surroundings. The difference is the scale at which we look.
Elevation tells us how high a location is relative to a vertical reference. Topographic Position Index (TPI) adds another perspective: how high or low is that location compared with the surface around it?
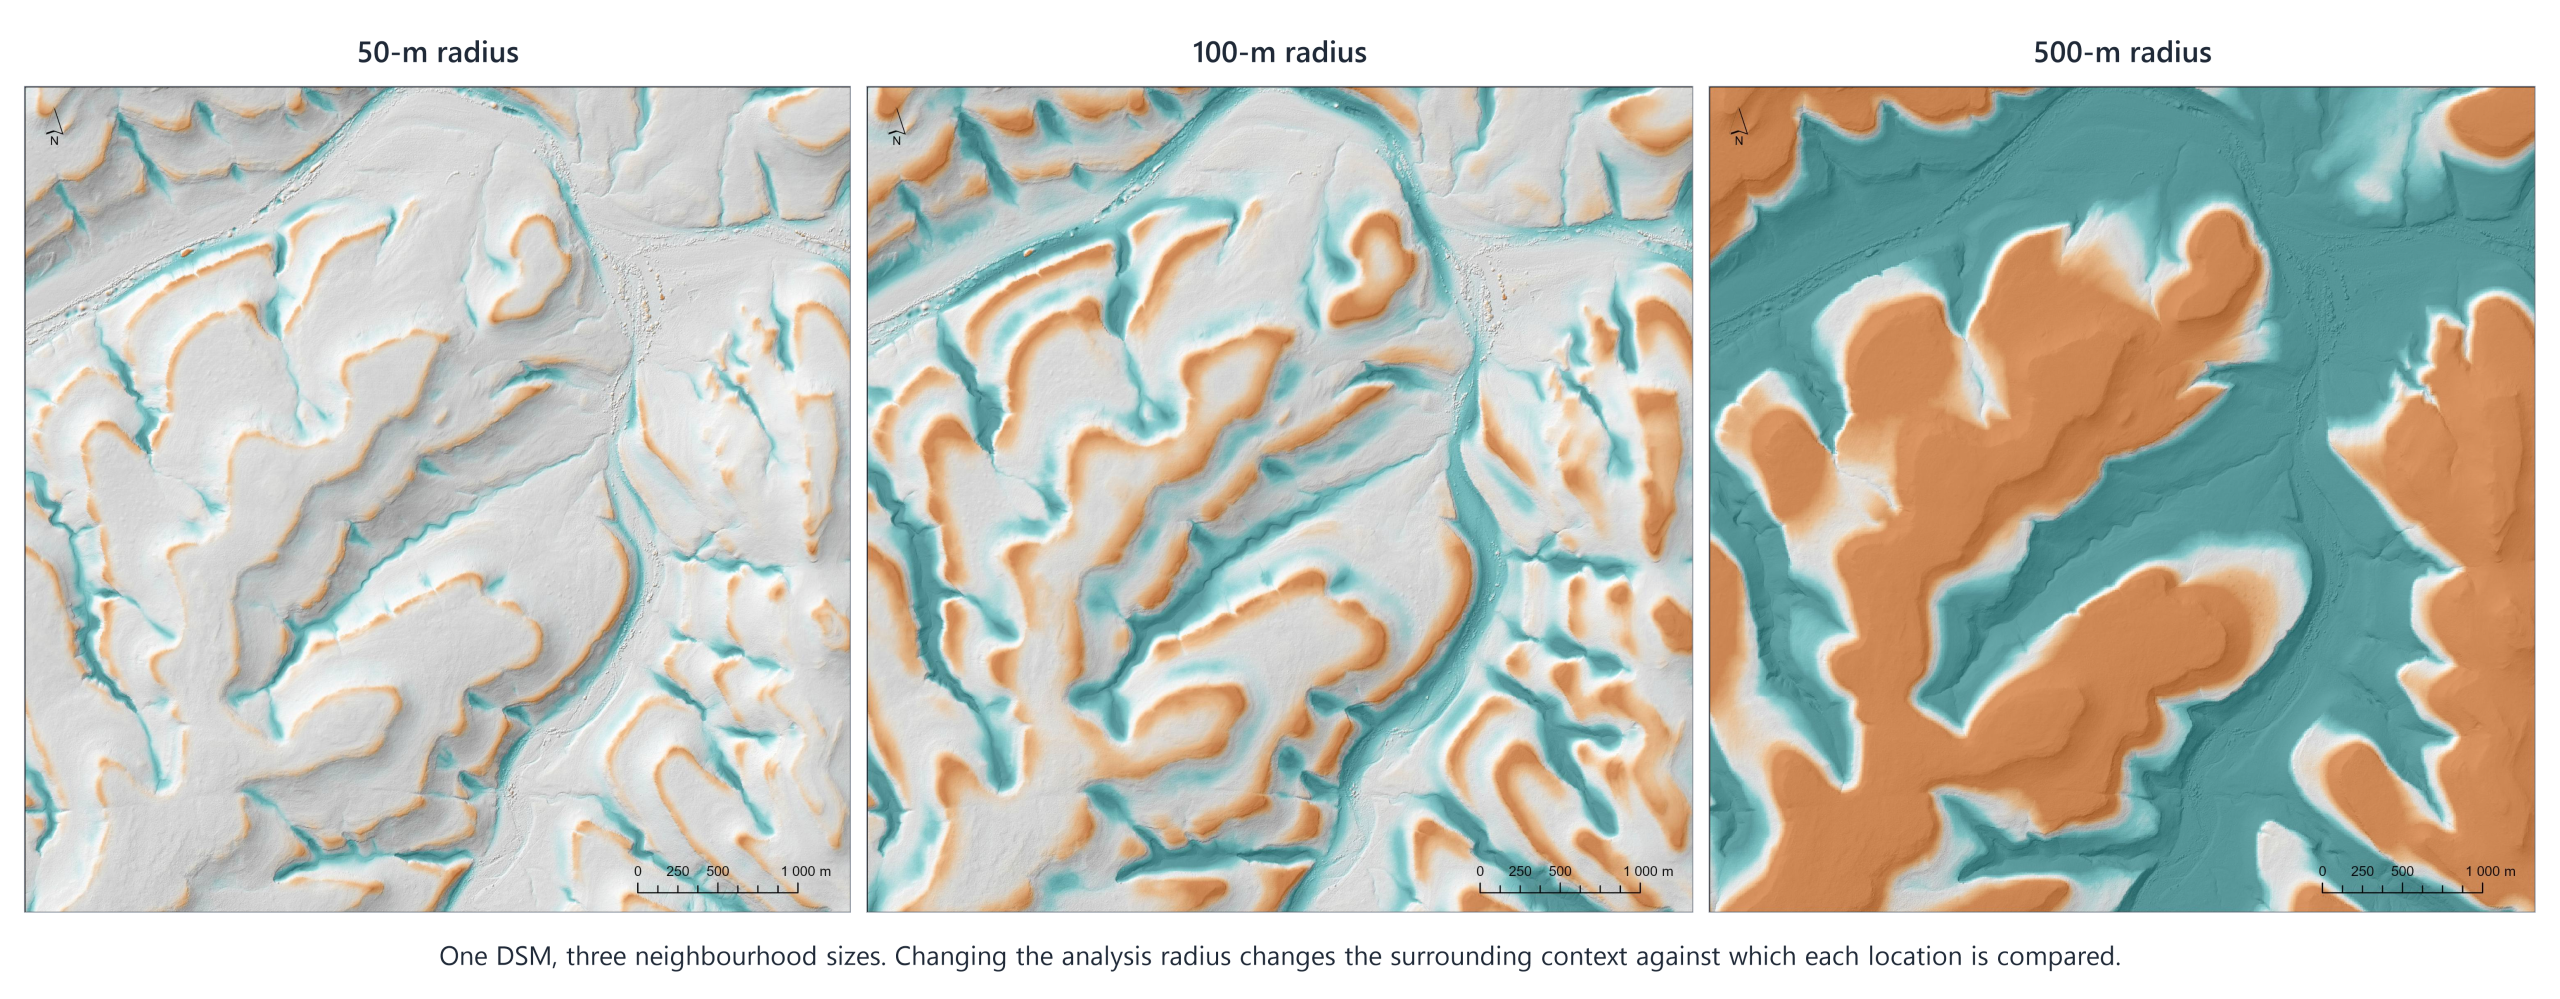
Using GeoSmart’s 2 m DEMSA2 Level 1 Digital Surface Model (DSM), we compare three neighbourhood sizes to explore how local surface features and broader landforms contribute to the same landscape.
 O
What does TPI tell us?
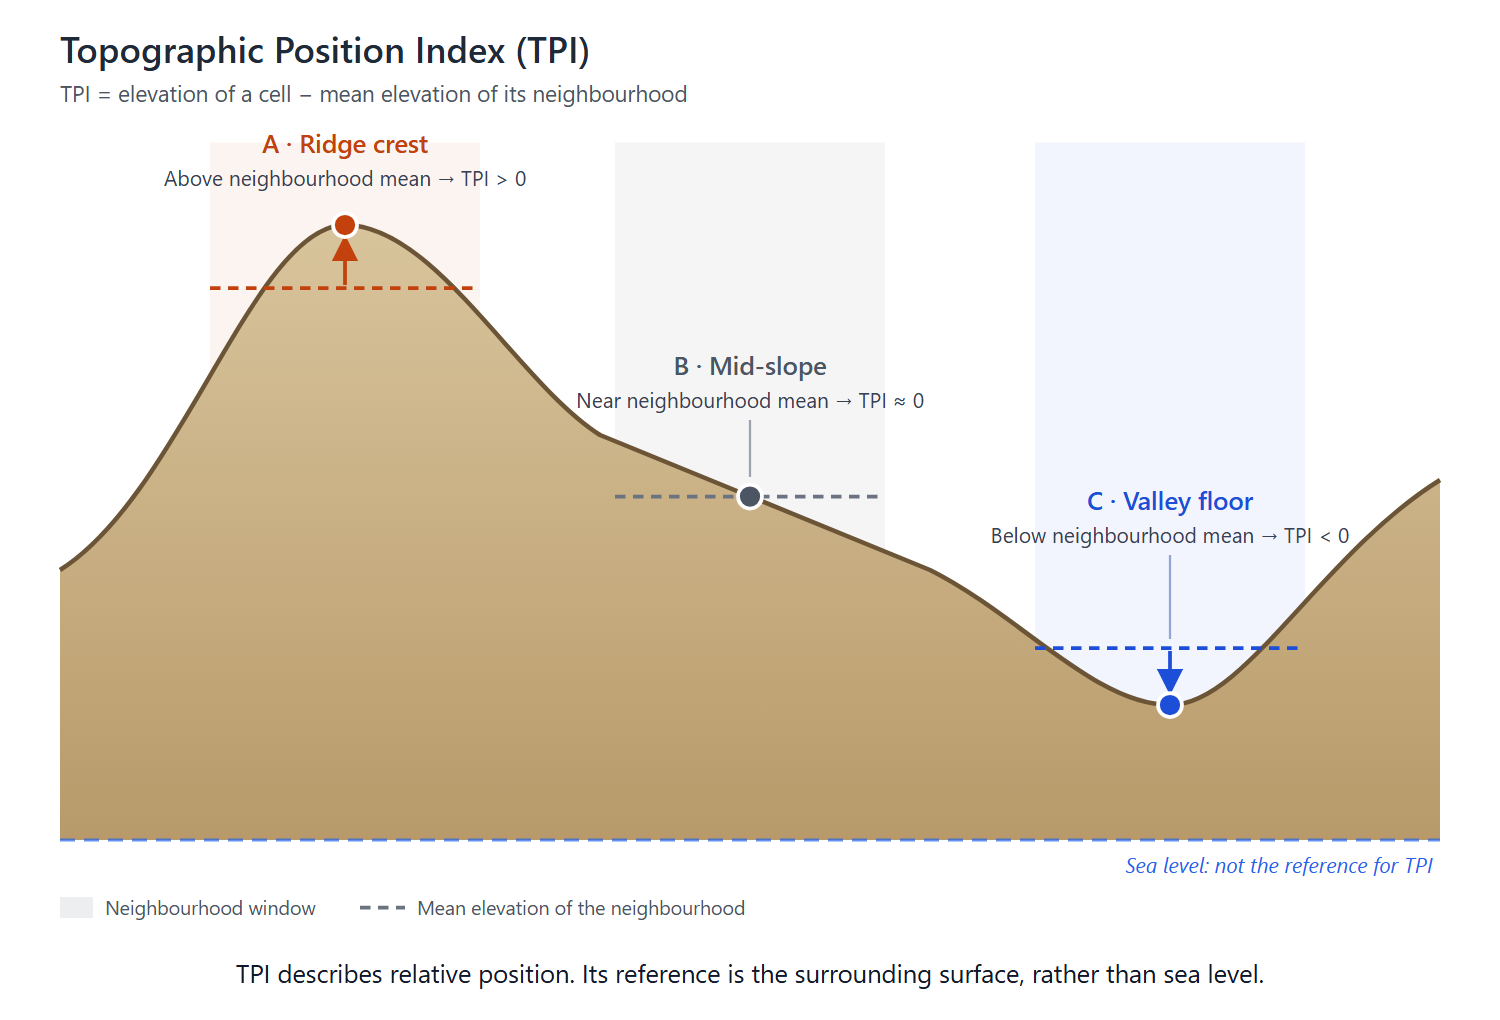
TPI is calculated by subtracting the average elevation of a surrounding neighbourhood from the elevation of the central pixel:
TPI = central pixel elevation − neighbourhood mean elevation
A positive value means the pixel is higher than its neighbourhood average. A negative value means it is lower. Values near zero indicate little difference from that average.
With unstandardised TPI calculated from elevations in metres, a value of +2 means the surface is two metres above the selected neighbourhood mean. It does not necessarily mean a building is two metres tall or that the ground has risen by two metres.
Near-zero values also need context. Both flat ground and a relatively uniform slope can have values close to zero. TPI works best alongside imagery, slope and other elevation derivatives.
Why calculate TPI at different scales ?
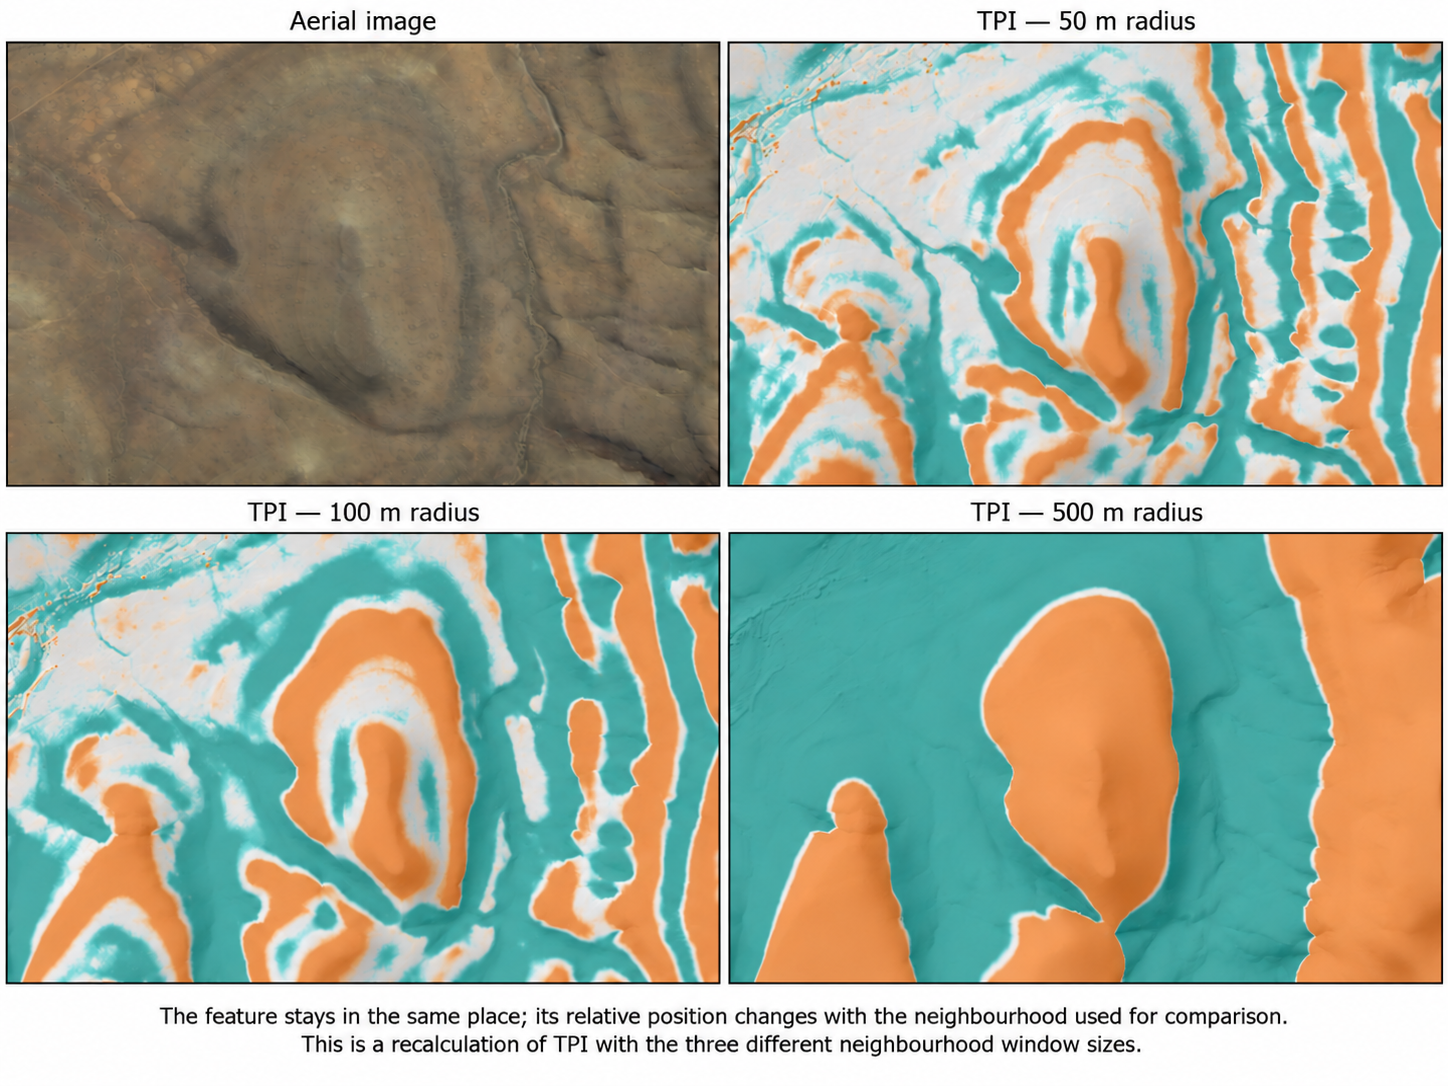
The neighbourhood, sometimes called the kernel or search window, defines what counts as “surrounding”. A small neighbourhood describes local differences. A larger neighbourhood places the same pixel in a wider landscape context.
In this comparison, the underlying DSM stays at 2 m resolution. We change the analysis radius, not the pixel size.
| Analysis radius | Window width | Features to investigate in the resulting map |
|---|---|---|
| 5 metres | 11 m | Local surface breaks, small embankments, narrow depressions, and building or vegetation edges |
| 50 metres | 101 m | Broader raised or excavated areas, local ridges, gullies and their surrounding slopes |
| 100 metres | 201 m | Wider patterns of relative elevation, including ridgelines, valley settings and large landform transitions |
These are investigation scales rather than guaranteed feature categories. Visibility depends on feature width, height, surrounding terrain and source quality.
For example, a raised platform within a valley could appear positive against its immediate surroundings but negative against the wider valley sides. Both results can be correct: they answer different questions about relative position.
Buildings and trees may remain prominent at larger radii. Increasing the neighbourhood does not remove surface objects or convert a DSM into a bare-earth model.
What does this mean for project planning ?
GeoSmart’s sector brochures describe applications across mining, infrastructure and energy, while our focussed client base includes engineering, geospatial and risk specialists. Multi-scale TPI can add useful context to these workflows:
- Civil engineering and infrastructure: Investigate embankments, cuttings and relative terrain positions along candidate corridors, together with slope, profiles and contours.
- Mining and rehabilitation: Examine the relative prominence of excavations, stockpiles and reshaped surfaces, with imagery and survey information to establish what each feature represents.
- Renewable energy: Compare local surface conditions with the wider terrain setting when screening sites and access routes. TPI complements the slope, hydrology and other constraints needed for design.
- Hydrology and risk assessment: Help interpret ridges, hollows and valley settings alongside drainage networks, flow accumulation, HAND and flood hazard information. Negative TPI alone does not establish flood risk.
- Environmental and land management: Investigate landform patterns relevant to erosion surveys, rehabilitation and landscape interpretation, supported by soil, land-cover and field evidence.
These are potential applications of the analysis, not claims that a particular client has commissioned this TPI comparison.
Choosing the right elevation product
DEMSA2 L1 is a DSM: its surface includes buildings and vegetation as well as terrain. This makes it useful for demonstrating how different surface features respond to a change in analysis scale. As a raw product, it can also contain photogrammetric artefacts that influence the result, particularly at small neighbourhood sizes.
For workflows requiring a quality-controlled surface, DEMSA2 L2 provides the curated DSM. For underlying terrain interpretation, DEMSA2 L3 provides the bare-earth DTM. GeoSmart’s SUDEM and FUSEDEM products offer further options for broader terrain analysis, depending on coverage and project requirements.
The neighbourhood must be specified in map units: a radius of 50 in a projected CRS is 101 m width, but will be different in a geographic CRS with degrees as map units.
Comparing different neighbourhoods shows variation across scale. Monitoring change over time requires datasets from different dates, consistent processing and checks on alignment and elevation accuracy; TPI can support interpretation, but this three-map comparison is not evidence of physical change.
Reading the colours
Our comparison uses teal for surface positions below the neighbourhood mean and orange for positions above it. Values near zero are transparent, allowing the underlying imagery or hillshade to remain visible.
This styling focuses attention on relative highs and lows while keeping their location recognisable. Transparent areas still contain valid data: they indicate little difference from the selected neighbourhood average, not necessarily flat ground or low risk.
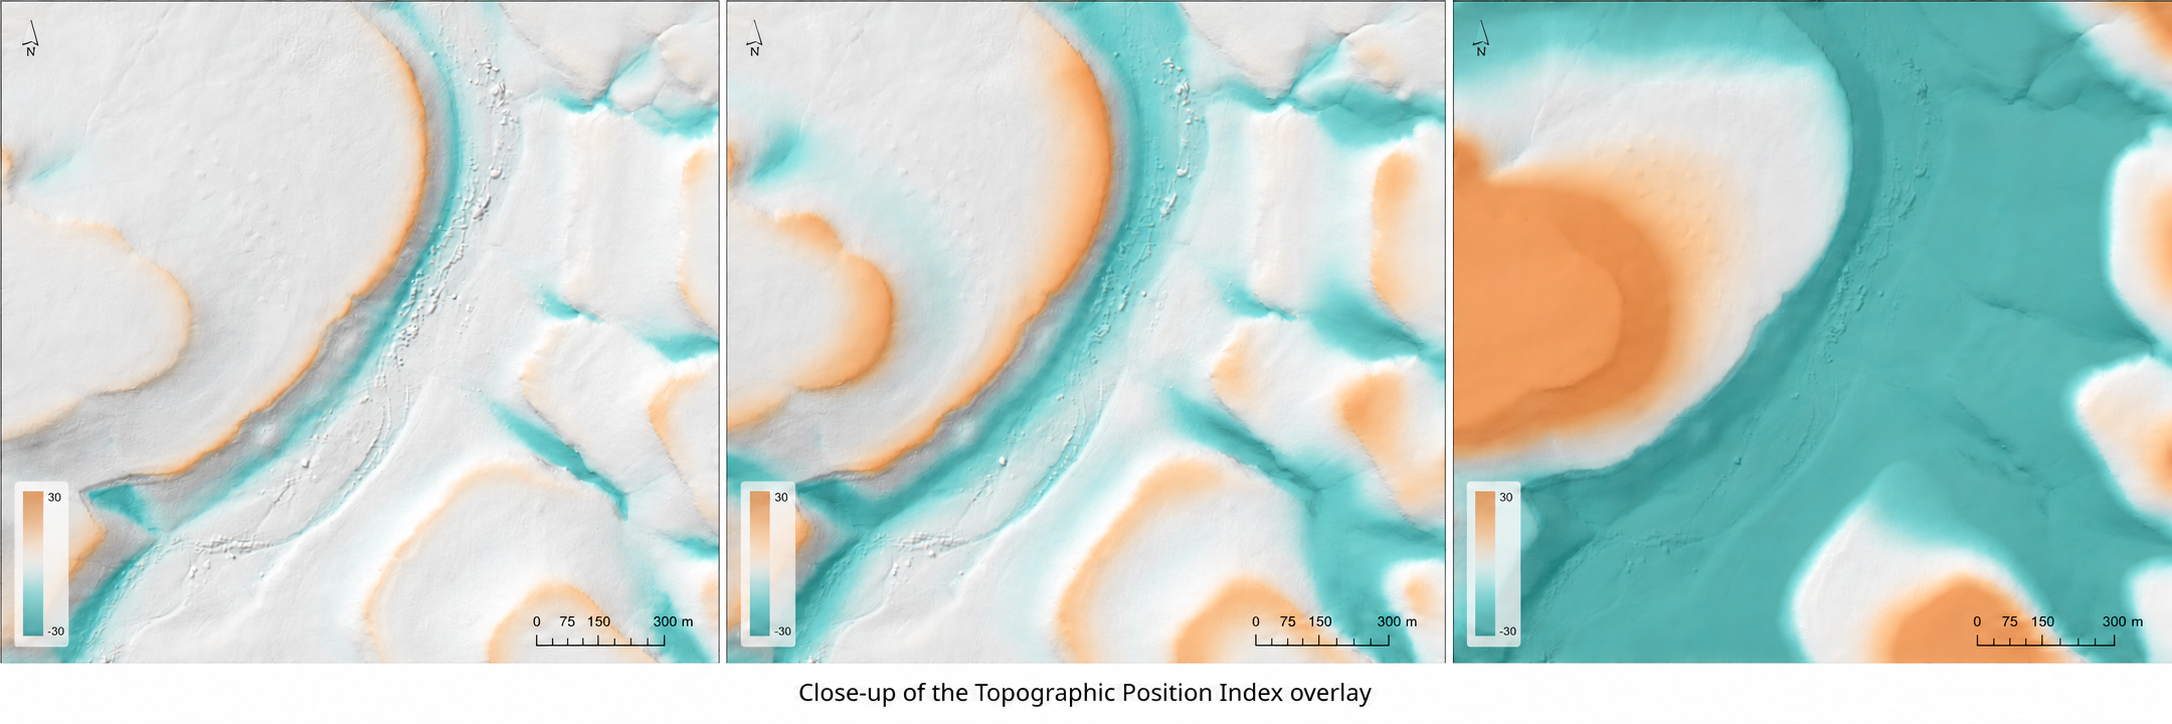
By using the same colour scale across all three maps, readers can compare equivalent elevation differences. A more saturated colour indicates a larger departure from the neighbourhood mean, rather than greater certainty or automatically greater risk.
Match the scale to the question
There is no single neighbourhood size that captures every useful surface feature and landform. Comparing several scales helps connect local detail with the wider terrain setting and identify where further investigation is worthwhile.
Contact GeoSmart Space to discuss the elevation model and terrain derivatives suited to your area of interest and project requirements.