
Comparing Digital Surface Models: SRTM, Copernicus, DEMSA2 and LiDAR
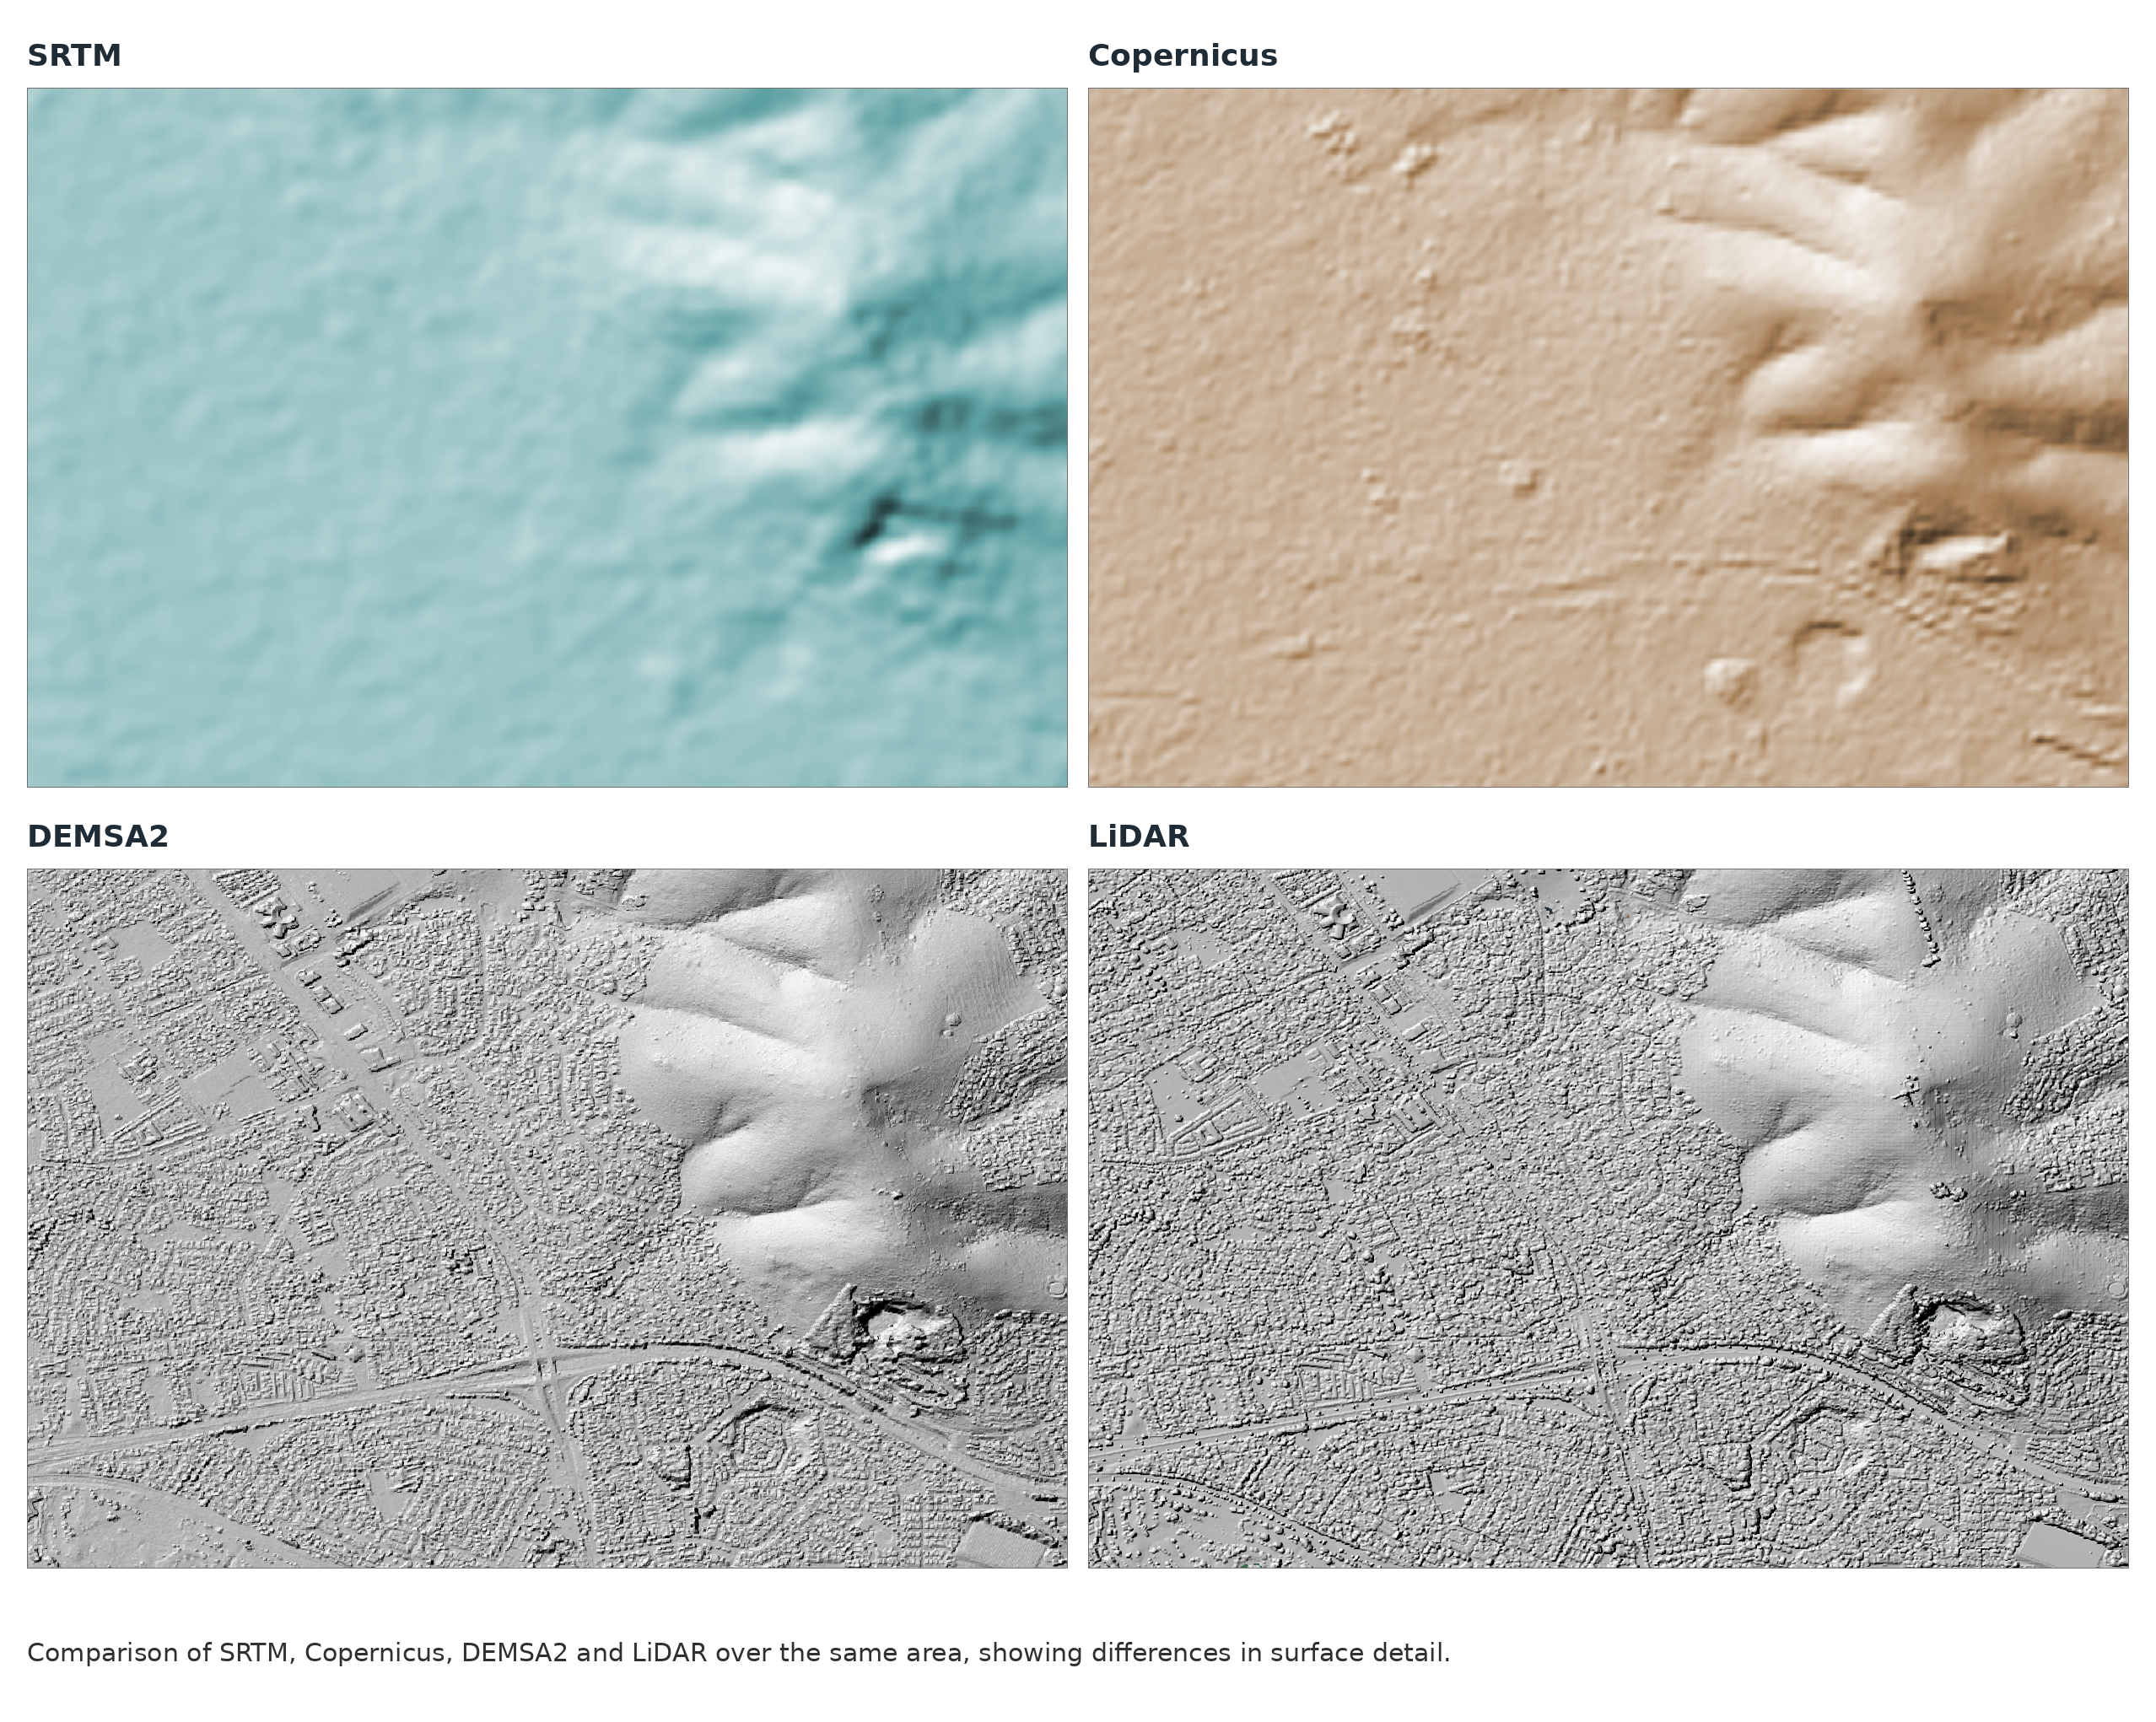
Digital surface models (DSMs) represent landscape heights, including buildings and vegetation. The sensor and processing method determine which surfaces are measured and how much detail the final model preserves
How are heights measured?
| Elevation source | Sensor and method | Typical surface representation |
|---|---|---|
| SRTM | Spaceborne C-band radar. Differences between signals received at two antenna positions are used to calculate elevation. | Broad landscape structure at approximately 30 m grid spacing in the commonly used global product. |
| Copernicus GLO-30 | Primarily spaceborne X-band radar from the TanDEM-X satellite pair, processed using radar interferometry. | An edited DSM at approximately 30 m grid spacing, including vegetation and built features where resolved. |
| DEMSA2 | Stereo aerial photogrammetry. Features matched between overlapping photographs are used to reconstruct 3D positions. | 2 m grid spacing. L1 and L2 represent surface features; L3 is processed into a terrain model. |
| Airborne LiDAR | Laser scanning. Pulse travel times are converted into distances and combined with sensor position and orientation to create a 3D point cloud. | Detailed surface or terrain models, depending on point density, classification and survey specifications. |
These methods and product characteristics are documented by USGS, Copernicus and GeoSmart
Why does vegetation look different?
Copernicus’s X-band radar has a wavelength of approximately 3 cm, compared with 5.6 cm for SRTM’s C-band product. X-band generally penetrates less deeply into vegetation, so its measured heights tend to lie closer to the upper canopy. However, both can represent a surface within the vegetation rather than the exact treetop or bare ground. Published TanDEM-X research confirms that X-band canopy penetration can produce significant height bias.
DEMSA2 photogrammetry reconstructs visible surfaces, including rooftops and tree canopies. LiDAR also captures these features, but some pulses reach the ground through gaps in vegetation. Classifying those returns allows a bare-earth terrain model to be produced where sufficient ground measurements exist.
What does this mean for data quality?
DEMSA2’s 2 m grid supports finer surface representation than the approximately 30 m SRTM and Copernicus GLO-30 grids. Published results also demonstrate its potential: a 2019 South African study reported a 90th-percentile elevation error of 2.17 m for DEMSA2, compared with 7.37 m for SRTM30, within the study area. These results apply to the datasets and conditions tested. DEMSA2 and airborne LiDAR can both support detailed local mapping.
Grid spacing is not height accuracy. Sensor specifications, acquisition conditions, processing, capture date and ground validation all matter. Choosing an elevation model means checking both the detail required and whether the task needs the visible surface or the ground beneath it.