Value of DEMs & Land Component Mapping for Land Suitability Analysis
Land evaluation compares and matches each potential land use with the properties of individual parcels of land. Such land suitability analyses are carried out on predetermined map units, called land units. Although any parcel of land can be considered a land unit, it is more efficient and meaningful to use parcels that can be adequately described in terms of one or a combination of land properties. A land unit should therefore represent an area that is, in terms of predetermined properties, different from the surrounding land and can be assumed to have homogeneous land properties. The degree of homogeneity or internal variation will vary depending on the scale and intensity set out in the evaluation objectives, but preferably the size of the land units should be kept as small as possible to limit generalisation – too many units can become unmanageable as each individual land unit is considered individually regarding its land properties and requirements.
While soil type boundaries would probably be the most suitable delineation of land units for agricultural land uses, soil information is often not available at the required scales. In such cases other available data sets, such as land components, can be used instead. Land components, or elementary landform units are often used as land units, mainly because their boundaries frequently coincide with transitions in environmental land properties such as soil, climate, and biology.
Land components such as cliffs, valley floors and channels are the most basic subdivisions of landscapes and can be combined to develop more complex geomorphological features such as landforms, hillslopes, land systems and land regions. Land components can be mapped by studying topographical maps, interpreting aerial photographs, and making field measurements. Such manual techniques rely on the interpreter’s implicit terrain-related knowledge of the area being studied and require skills that are the product of long and expensive training and experience. A major drawback of manual terrain analysis is its subjective nature, because in most cases it is impossible to make any useful comparisons between land component maps produced by different analysts or even by the same analyst at separate times. In addition, the interpretation and mapping of land components are extremely time-consuming, labour-intensive, and prohibitively expensive tasks.
The increasing availability of digital elevation models (DEM) has promoted the use of computer technology for calculating and discriminating terrain properties. DEM-derived data sets such as slope, aspect, hydrographical pattern, and shaded relief are not only less prone to human error but can be used to compare terrain units objectively and quantitatively. A common approach to mapping land components is to use geographical information systems (GIS) to analyse and combine DEM derivatives (e.g., slope gradient, aspect, and curvature) to create unique morphological units. The process of delineating (or segmenting) land components from DEM is a fundamental research problem in geomorphology. One methodology is to identify morphological discontinuities (i.e., slope breaks, slope changes and inflections) by finding local extremes of altitude, slope gradient, and other DEM derivatives. This morphological mapping or graph-based approach assumes that land surfaces consist of planes bounded by morphological discontinuities and that these planes represent individual land components. However, developing computer algorithms to successfully detect and delineate subtle discontinuities is challenging, particularly when relatively low-resolution DEM are used as input. Another approach to land surface segmentation is to define land components according to their internal properties. In this classification approach, map units (cells) that have similar attributes (e.g., slope gradient, aspect, plan, and profile curvature) are grouped together to produce classes with minimal “intraclass” and maximum “interclass” differences. The classification is then applied to the original input data to produce regions representing similar terrain properties. Although many variations of this approach exist (e.g., overlaying, cluster analysis, fuzzy sets) they all aim to classify terrain into “homogeneous regions.” A recent variation of this methodology is the use of object-oriented techniques to segment and classify elementary units. The ability of multi-resolution image segmentation (MRS) to extract locally distinct “objects” from multiple input variables holds much potential for geomorphologic applications.
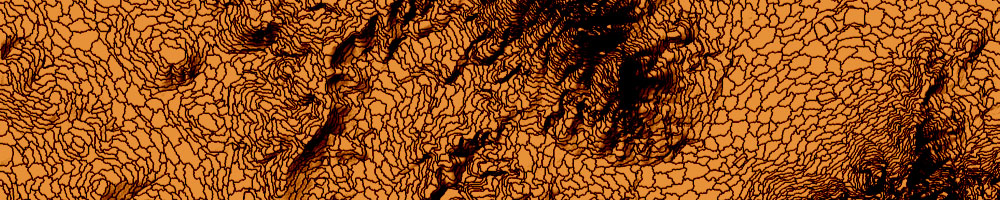
The figure below demonstrates how MRS and the DEMSA2 Level 3 (DTM) product can be used to delineate individual land components in the Stellenbosch region that are internally homogenous and distinct from their neighbours (in terms of their terrain characteristics).
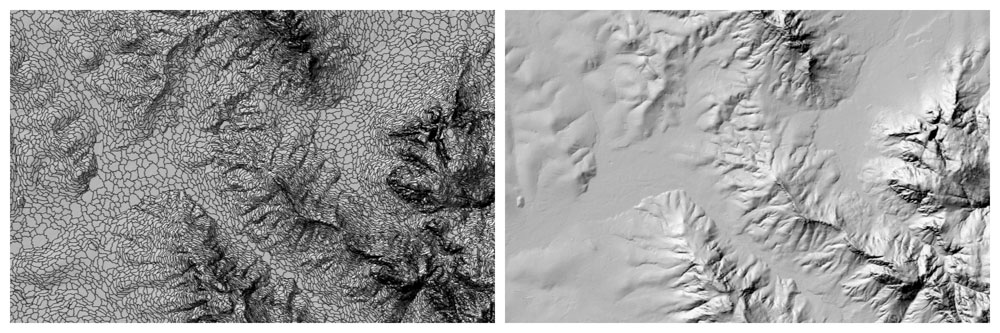
These units are ideal for crop and cultivar suitability analysis because they represent areas with similar environmental (bio-physical and climatic) characteristics. They can consequently also be considered as terroir units. GeoSmart is working closely with TerraClim to identify areas suitable for different crop and cultivar types.
This article was adapted from “Van Niekerk A 2010. A comparison of land unit delineation techniques for land evaluation in the Western Cape, South Africa. Land Use Policy, 27(3): 937-945. https://goo.gl/DSCA2Y“