
Detailed Land Cover Classification
Detailed Land Cover Classification Using Remote Sensing, Segmentation, and GIS Layers
Land cover classification is a fundamental tool in environmental management, land use planning, and agricultural monitoring. With the availability of high-resolution satellite and aerial imagery, modern techniques allow us to extract meaningful, accurate information about the Earth’s surface. By combining spatial statistical measures, object-based image segmentation, and multiple GIS layers, we can produce highly detailed and reliable land cover maps suited to a wide range of applications.
By integrating spectral indices, segmentation, aerial and satellite imagery, and GIS data layers, land cover classification becomes a powerful, multi-dimensional process. It allows decision-makers, researchers, and planners to move beyond basic maps and into actionable, data-driven insights tailored for agriculture, conservation, urban planning, and climate resilience
At the heart of land cover analysis is the use of spectral indices. The Normalized Difference Vegetation Index (NDVI) is commonly used to assess vegetation health and density by measuring the difference between red and near-infrared reflectance. NDVI highlights green biomass, allowing analysts to distinguish between forest, crops, and barren land. Similarly, the Normalized Difference Water Index (NDWI) uses green and near-infrared reflectance to identify water bodies. The Brightness Index, derived from visible and near-infrared bands, helps identify urban areas, bare soil, or reflective surfaces. These indices guide the classification process by providing quantifiable thresholds for different land cover types.
To improve the accuracy and usability of classification outputs, image segmentation is applied using multi-resolution segmentation (MRS). This method groups pixels with similar spectral and spatial properties into larger objects or segments. Each segment can then be analyzed based on its average spectral index values, shape, size, and texture. This object-based approach reduces pixel-level noise and allows for more context-aware classification. For example, a patch of land with high NDVI and compact shape may be classified as cropland, while an irregular segment with high NDWI is more likely a wetland.
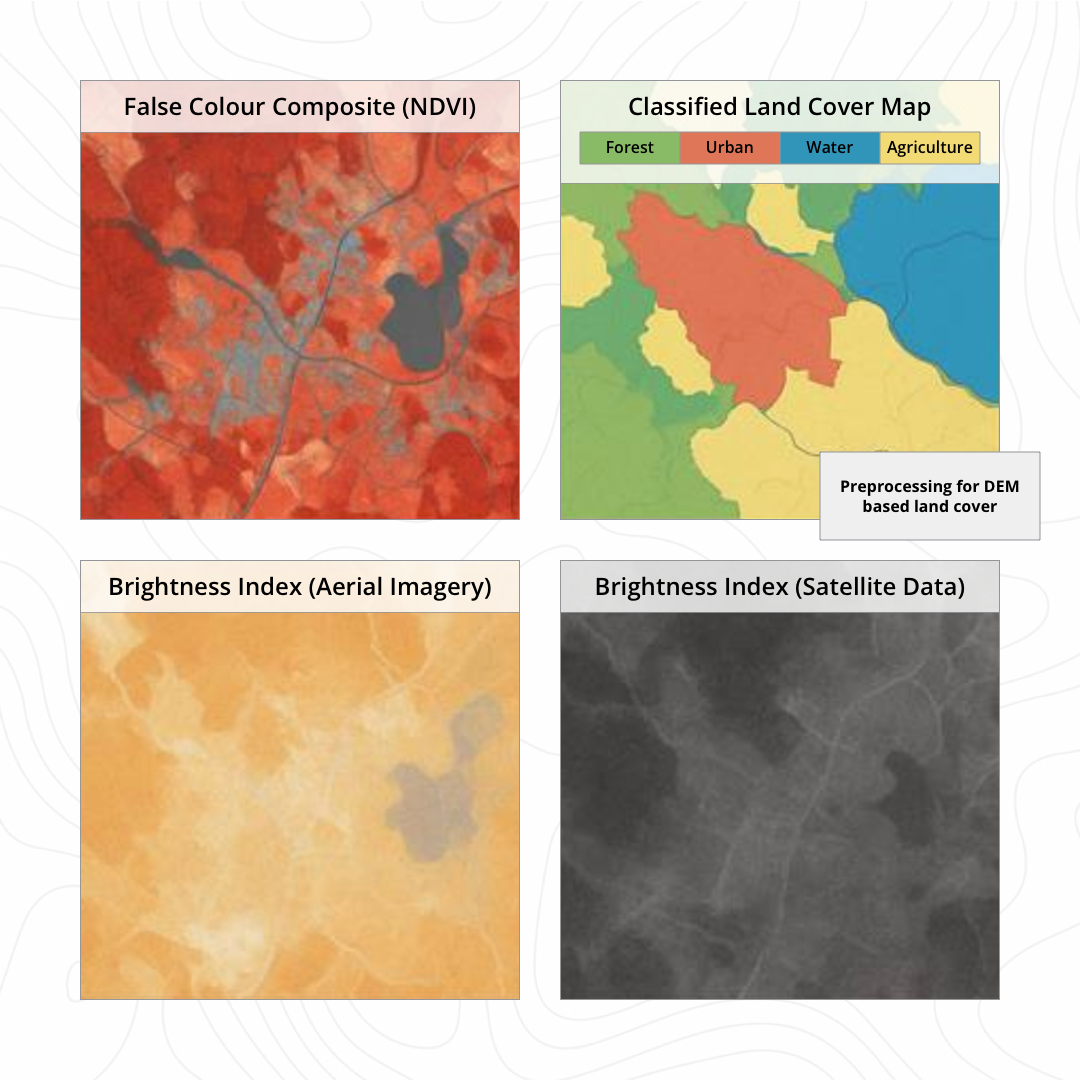
False color composites support visual interpretation and validation. A typical arrangement might show NDVI in bright red in the top left, land cover classes in the top right, and two types of Brightness Index maps—one from aerial data and one from satellite imagery—in the lower panels. This layered visualization supports cross-comparison and segmentation during preprocessing for Digital Elevation Model (DEM) generation, which adds terrain context to land cover types.
To further refine classifications, analysts incorporate multiple GIS layers into the model. These can include elevation, slope, aspect, soil type, hydrology, infrastructure, and administrative boundaries. For example, combining NDVI with slope data helps distinguish natural vegetation on steep terrain from managed crops on flat land. Soil moisture data can help verify NDWI-derived water features, while roads and urban boundaries improve the identification of built-up areas.
All of these layers contribute to rule-based classification systems, where logical conditions are set to assign land cover classes based on a combination of spectral and spatial attributes. This method allows for scalable, reproducible results and enables updates as land use changes or new data becomes available.
In summary, by integrating spectral indices, segmentation, aerial and satellite imagery, and GIS data layers, land cover classification becomes a powerful, multi-dimensional process. It allows decision-makers, researchers, and planners to move beyond basic maps and into actionable, data-driven insights tailored for agriculture, conservation, urban planning, and climate resilience