
Digital elevation model types
Last week we looked at reasons for why you would want to include elevation data in your spatial analysis (see it here if you missed it). This week we will be looking at the two main models for representing digital elevation data, namely the vector and raster models, as well as the distinction between surface and terrain models.
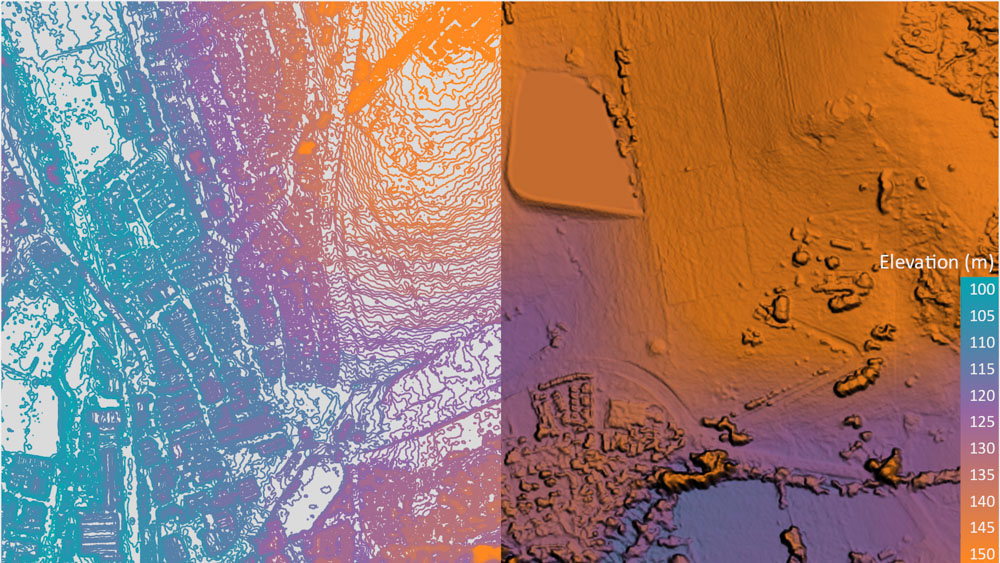
The image above shows DEMSA2 data in both vector and raster data models. On the left half, elevation is visualised in a vector format by use of contours lines, with each line indicating a specific elevation. On the right, elevation is represented by a raster (grid), with cell (or pixel) values indicating the average elevation for that cell. Such data is called a digital elevation model (DEM). The difference between the two models becomes apparent when you take a closer look…
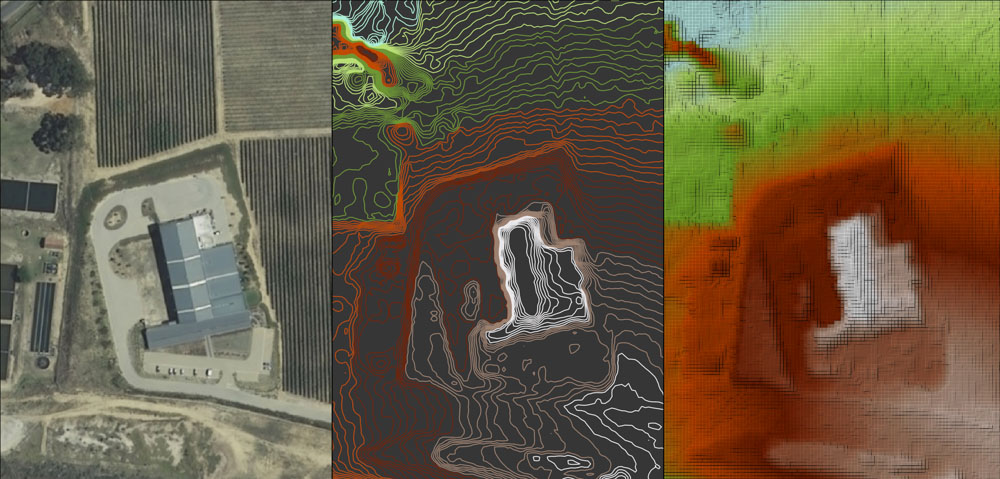
In the middle we use contour lines at a 0.5 m vertical interval to represent the building (shown on the left), whereas on the right we use the DEMSA2 (a 2 x 2 m elevation grid) to represent the same building. Notice that at this scale, the elevation raster’s grid visisble and the image begins to get ‘pixelated’ in appearance.
As for the differences between the models – the most obvious one is that raster elevation data is similar to images as it provides continuous coverage over an entire area (i.e. it is a surface), whereas vector data generally does not (notice the gaps between the contour lines in flat areas). Whether or not this distinction matters to you is entirely use case (application) dependent. Raster-based elevation data does however have the advantage of allowing the data to be easily synthesized with other raster datasets such as multispectral satellite imagery and can be used to derive additional information by generating DEM derivatives, but that is a topic for another day.
Although our elevation products are generated and stored as DEMs (e.g. TIF, IMG, JPEG), we have the ability to provide the data as elevation contours in a range of vector formats, including shape files, CAD drawings (e.g. DXF), geodatabases, or strings of texts (e.g. geoJSON, Well Known Text formats). We can even provide the data as triangulated irregular networks (TINs)
SURFACE OR TERRAIN?
Another important aspect of terrain data that needs to be considered is what is being represented – is it a surface model or a terrain model? The distinction between these is a subtle one, but it could be critical to your application.
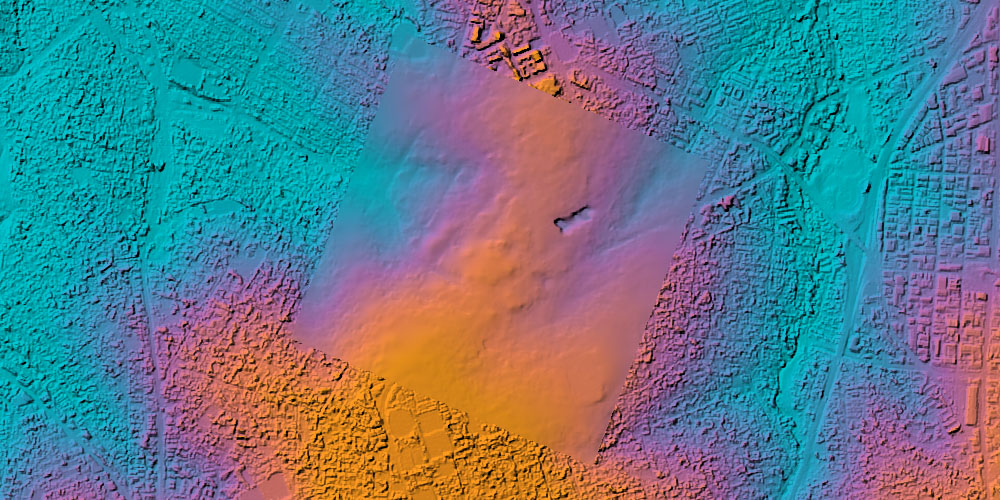
A digital surface model (DSM) represents the surface of terrain as viewed from above and as such it includes surface objects such as trees and buildings. A digital terrain model (DTM) on the other hand represents the terrain underlying these features. Below we have an example of a DEMSA2 L2 DSM, overlaid with the DEMSA2 L3 DTM for Sandton:
The question of which of these would be best applied to your use-case is a tricky one. For land cover classification, and terrain orthorectification, it is critical to have surface feature information at hand. However, if you are planning an excavation in a forest, you might want to consider a DTM to not include the canopy height in your volume calculations. Whatever your use-case may be though, get in touch with us and we will be happy to help you to find the data that is best for you.
We look forward to seeing you next week for our follow up entry on the topic of DEM derivatives. Please follow us on Facebook, Twitter and/or Instagram to be sure not to miss it!
Published 2020-10-09