
Viewshed Analysis
For this week’s post we will be having a look at a brand new solution we are offering – viewshed analysis!
Viewshed analysis is when a digital elevation model (DEM) is used to determine the line of sight, or visibility. Generally, the viewshed analysis process takes a vantage point (or set of vantage points), the height of the observer (e.g. this can be a person standing or it can be the height of a tower), the height of the target and a DEM (commonly DSMs are used) as input, and outputs a raster showing which areas (pixels in the DEM) are visible from the vantage point(s).
But enough theory! Let us use an example of how viewshed analysis could be applied in practise. Take a look at our DEMSA2 data for the Great Fish River National Park:
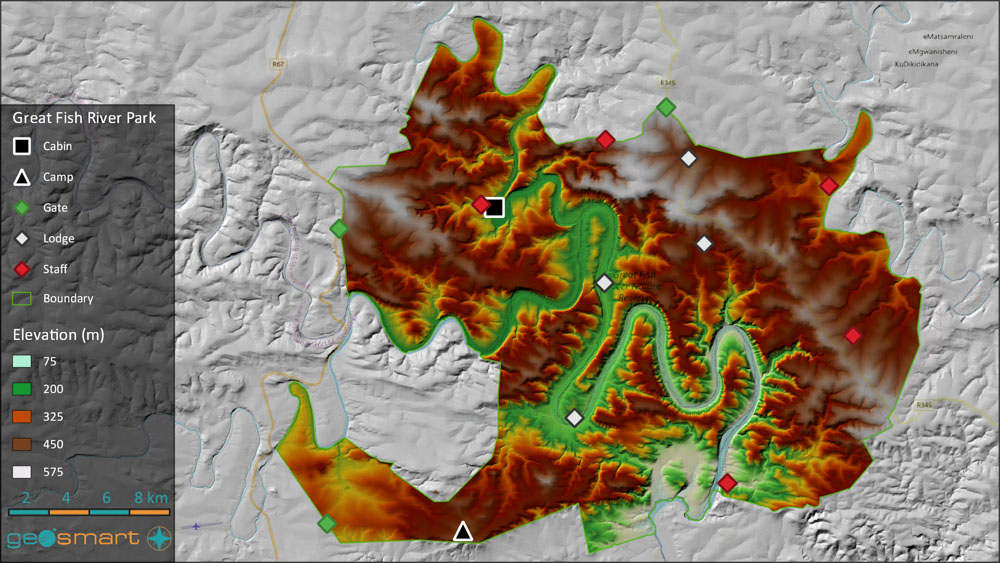
A simple example of a viewshed problem would be to calculate the visibility from one of the lookout points. To do so, we define the lookout point’s coordinates, set the observer height to 1.6 m (i.e. more or less the height of a person standing) and set the target height to 0 (ground level).
The blue areas in the figure below indicates the areas (as modelled in the DEMSA2) that would be visible by a person standing at the lookout point. As you can see, the viewpoint provides a spectacular view into the bend of the Fish River.

However, it is important to keep in mind that visibility goes both ways – the viewpoint itself would also be visible from anywhere in the blue region. This aspect of viewshed analysis makes it extremely useful for certain planning applications.
Let us imagine that we were interested in setting up a wireless internet network in the park, to be used by the staff, guests, conservationists and to lay the groundwork for future internet of things (IoT) projects. Now, instead of using only a single point, we input all of the points of interest (POI) in the park (e.g. cabins, gates, camps, lodges, staff accommodation), as shown in the park map presented earlier, and set the observer and target heights to 10 m (to simulate the line of sight at the top of a 10 m tall signal mast). We can also calculate a visibility network, which indicates which of the POIs are already in each other’s line of sight for the given parameters.
This output map below shows that six of the POIs in the park would be connected to a network if signal towers are established at the existing POIs. It also highlights a number of regions (green to blue shades) that are possible candidates for additional towers to ensure complete network coverage for the entire park.

We hope that this post has served to inform you of one of the many possibilities offered by our elevation data products. Some other examples would be:
- Modelling the visibility of wind turbines as part of an environmental impact study.
- Predicting the view from a planned skyscraper.
- Evaluating the coverage from planned telecommunications towers.
If you have any questions about this new offering, please get in touch!
Published on 2020-10-29